10 Common Chart Patterns that every trader should know of

Chart Patterns! The Key visual tools that reflect the market sentiments and potential price movements through price action scanners.
They serve as valuable indicators, offering insights into potential trend reversals, continuations, and entry/exit points. It is because of this intrinsic ability to chart patterns that it becomes crucial to understand these patterns and then devise trading strategies accordingly.
Below, we will discuss some common chart patterns that every trader should be aware of, and when and where to place the stop loss orders,
But,
Before that, it's essential to have a look at the broad categories of Chart Patterns so that you have a deeper understanding of these individual patterns
Types of Chart Patterns:
Each Chart pattern described in this blog belongs to one of these categories; let's break down each;
Bullish Chart Patterns:
Bullish chart patterns are formations observed on financial charts that suggest a potential upward movement in the price of an asset. These patterns are often considered signals by traders and investors that the current trend may continue or that a new upward trend is likely.
Bearish Chart Patterns:
Conversely, bearish chart patterns are formations on charts that indicate a potential downward movement in the price of an asset. Traders and investors interpret these patterns as signals that the current trend might persist or that a new downward trend is emerging.
Bullish Trend Reversal Chart Patterns:
Bullish trend reversal chart patterns are specific chart formations that suggest a potential change in the prevailing downtrend to an uptrend. These patterns indicate that sellers may be losing control, and buyers are gaining strength, potentially leading to a shift in the overall market sentiment from bearish to bullish.
Bearish Trend Reversal Chart Patterns:
On the other hand, bearish trend reversal Chart patterns are chart formations that signal a potential shift from an existing uptrend to a downtrend. These patterns suggest that buyers may be losing control, and sellers are gaining influence, potentially leading to a change in market sentiment from bullish to bearish.
OK, So now we move to our list of 10 Chat Patterns;
Common Chart Patterns
Following are the most common types of chart patterns that can give you various opportunities to enter or exit the trades;
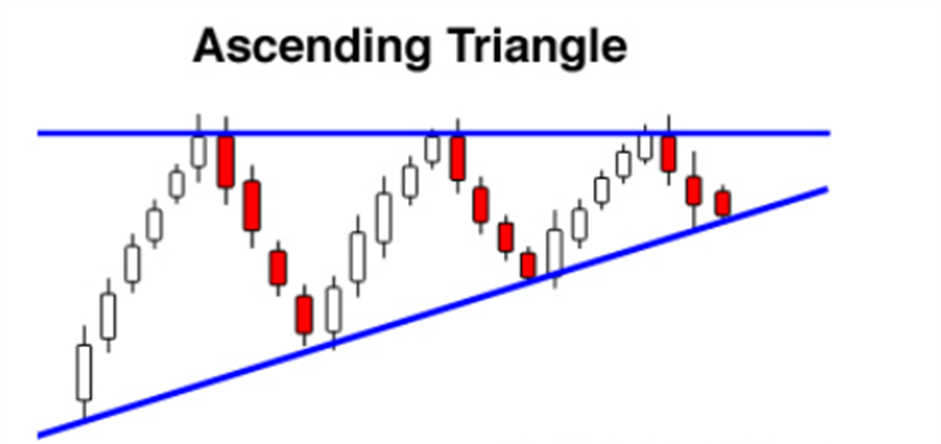
1. Ascending Triangle
The Text Book Drawing of the Ascending Triangle Chart pattern looks more like this!
While a Chart in Actual trading may look like this ,
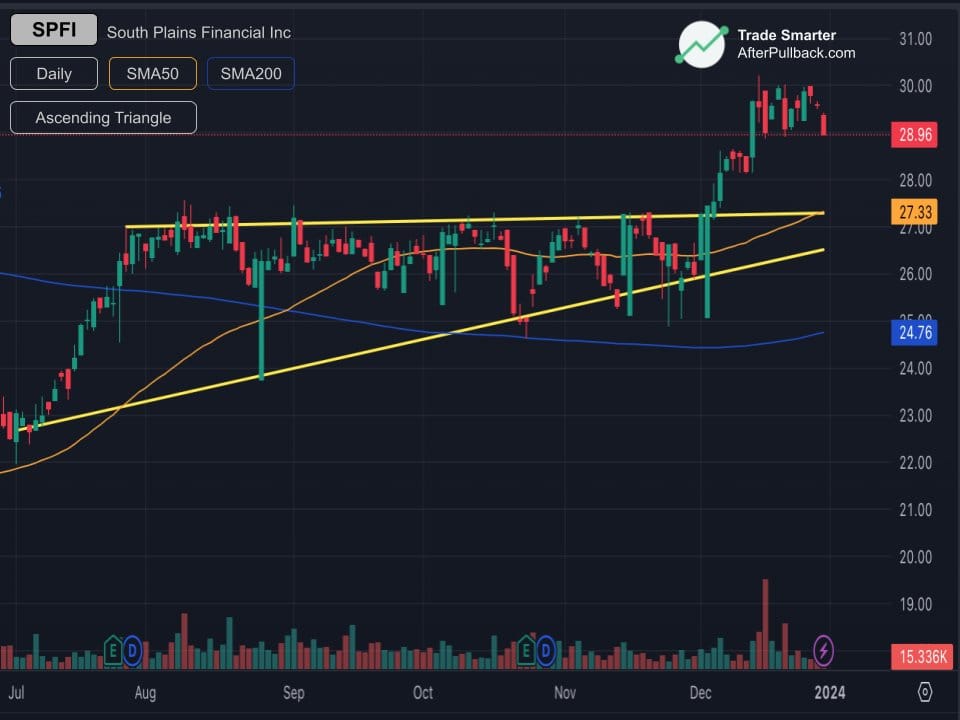
An ascending triangle is a bullish chart pattern characterized by a series of higher lows converging toward a horizontal resistance level. This pattern signifies a potential continuation of an existing uptrend, with the ascending trendline indicating increasing buying pressure.
The ascending triangle is rooted in technical analysis, emphasizing the psychological dynamics between buyers and sellers. As the price consistently forms higher lows, it suggests that buyers are becoming more aggressive in their pursuit, leading to a potential breakout when the price encounters horizontal resistance.
Traders often use ascending triangles to identify potential breakout opportunities. The pattern provides insights into the balance between bullish and bearish forces, aiding traders in anticipating future price movements.
Components of Ascending Triangle:
- Horizontal Resistance:
The horizontal line connecting multiple swing highs acts as a resistance level. It indicates a point where selling pressure has historically prevented the price from advancing further.
- Ascending Trendline:
Formed by connecting the successive higher lows, the ascending trendline showcases the increasing willingness of buyers to enter the market at higher prices.
Entry, Exit, and Target Price in Ascending Triangle:
Traders often enter a long position when the price convincingly breaks above the horizontal resistance, signaling a potential upward continuation. A surge in volume typically confirms entry.
The target is estimated by measuring the height of the triangle at its widest point and adding it to the breakout level. This projects a potential upward move.
A stop-loss is commonly placed just below the ascending trendline or the recent swing low, safeguarding against false breakouts or trend reversals.
Factors to Consider in Ascending Triangle:
a. Duration of the Triangle:
The longer the duration of the ascending triangle, the more significant the potential breakout. Extended consolidation periods indicate a more substantial buildup of pressure.
b. Volume:
Breakouts accompanied by a surge in volume enhance the reliability of the pattern. Volume confirms the strength of the bullish sentiment.
c. Trend Confirmation:
Ascending triangles are more potent when aligned with the prevailing trend. A pattern forming within an established uptrend is more likely to result in a successful breakout.
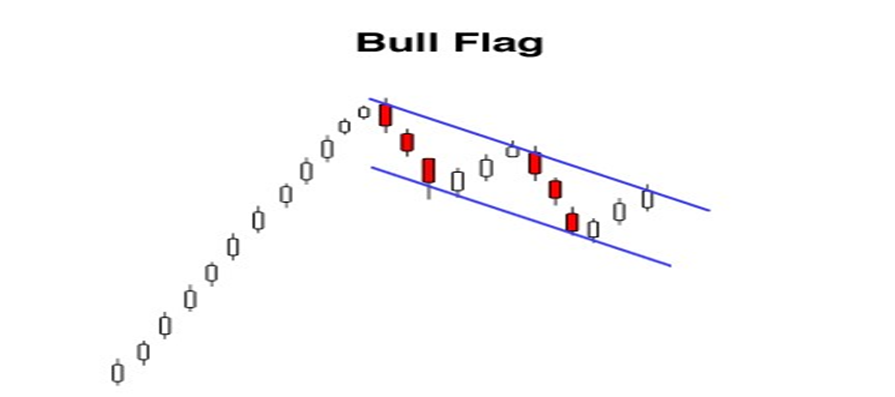
2. Bull Flag:
The Text Book Drawing of the Bull Flag Chart Pattern is more like this
While in actual trading, It may look like this;
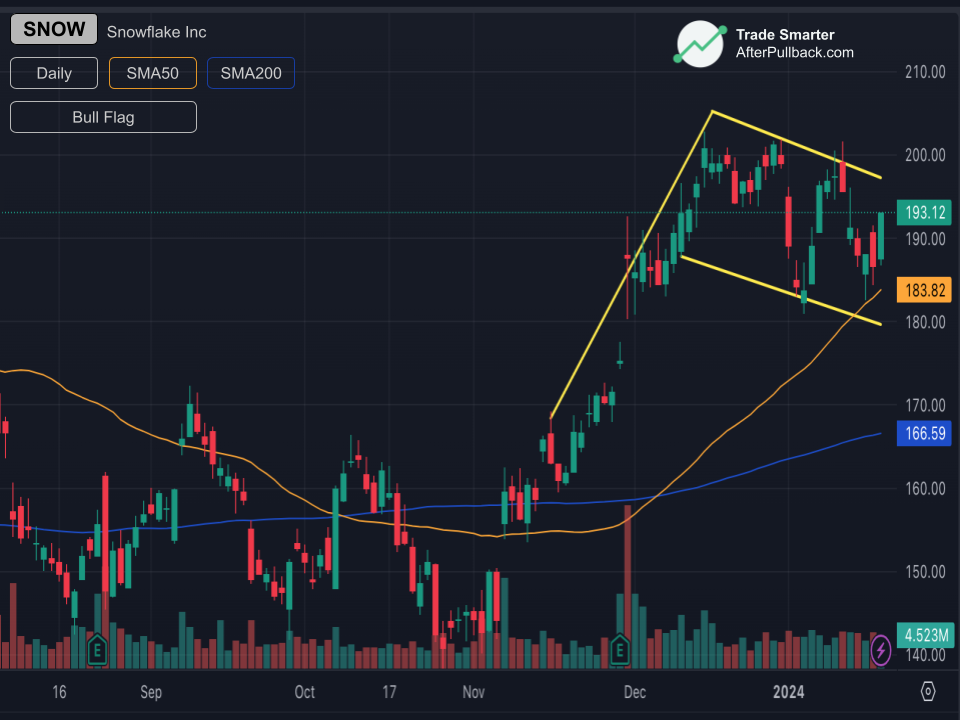
A Bull Flag is a bullish continuation pattern in technical analysis, typically observed in financial charts. It represents a brief consolidation or pause in an existing uptrend, followed by a resumption of upward price movement.
Traders utilize Bull Flags to anticipate future price increases within an established trend, allowing for strategic entry points.
Components of Bull Flag:
a. Flag Pole:
The flagpole is the initial strong upward price movement that precedes the flag pattern. It signifies a rapid advance in the market.
b. Flag:
The flag is a rectangular-shaped consolidation pattern that forms after the flagpole. It consists of lower highs and lower lows, reflecting a temporary pause or profit-taking within the existing trend.
Entry, Exit, and Target Price in Bull Flag:
Traders often enter a Bull Flag pattern when the price breaks above the upper trendline of the flag. This breakout signals a potential continuation of the previous uptrend.
To estimate the target price, measure the length of the flagpole and project that distance upward from the breakout point. This provides a potential target for the price movement.
Place a stop-loss order slightly below the lower trendline of the flag. This helps manage risk in case the pattern doesn't play out as expected.
Factors to Consider in Bull Flag:
a. Duration of the Triangle:
A more extended consolidation period in the flag tends to result in a more potent breakout. Traders should consider the duration of the flag formation.
b. Volume:
Volume analysis is crucial. Increasing volume during the flagpole and a noticeable decrease during the flag's formation can signal a healthy pattern.
c. Trend Confirmation:
Confirm the overall market trend before relying on a Bull Flag. This pattern is most reliable in the context of an established uptrend.
3. Bear Flag
The Text Book Drawing of the Chart is more like this

While in actual trading, It may look like this;
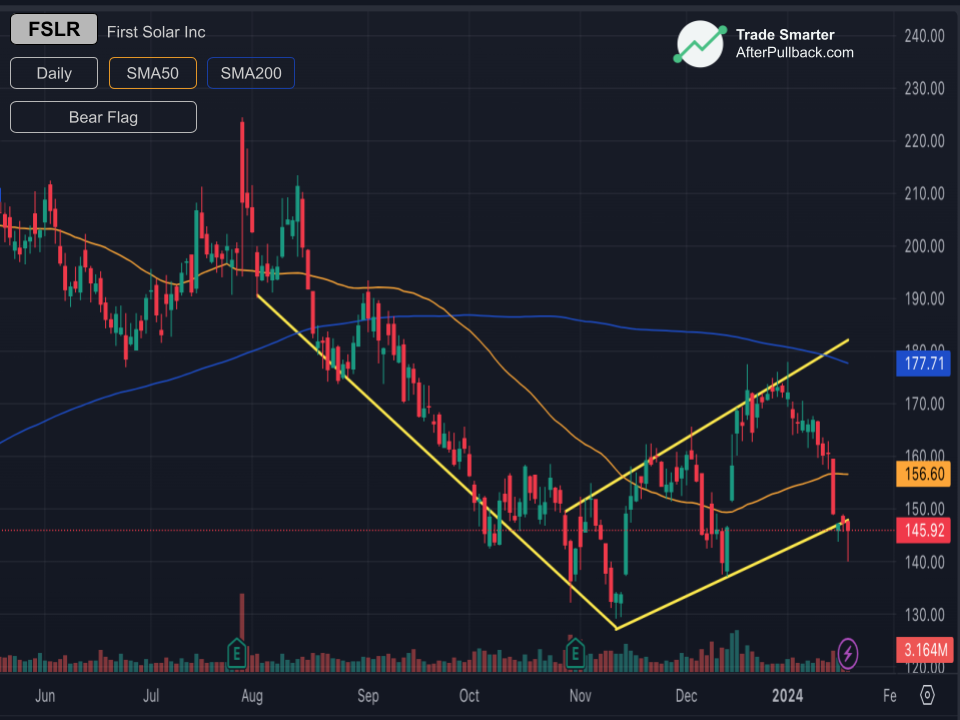
A Bear Flag is a bearish continuation pattern in technical analysis. It appears as a brief consolidation or pause within a downtrend, followed by a continuation of the downward price movement.
Traders use Bear Flags to spot opportunities for short positions within an established downtrend.
Components of Bear Flag:
a. Flag Pole:
Similar to the Bull Flag, the Bear Flag begins with a solid downward price movement called the flagpole, indicating a rapid decline in the market.
b. Flag:
The flag is a rectangular-shaped consolidation pattern that forms after the flagpole. It consists of higher lows and lower highs, representing a temporary pause or potential retracement within the existing downtrend.
Entry, Exit, and Target Price in Bear Flag:
Traders typically enter a Bear Flag pattern when the price breaks below the lower trendline of the flag. This breakout signals a potential continuation of the preceding downtrend.
To estimate the target price, measure the length of the flagpole and project that distance downward from the breakout point. This provides a potential target for the price movement.
Place a stop-loss order slightly above the upper trendline of the flag to manage risk in case the pattern doesn't unfold as expected.
Factors to Consider in Bear Flag:
a. Duration of the Triangle:
Similar to the Bull Flag, a more extended consolidation period in the flag tends to result in a more significant breakout. Traders should consider the duration of the flag formation.
b. Volume:
Volume analysis is critical. Increasing volume during the flagpole and a noticeable decrease during the flag's formation can signal a healthy bearish pattern.
c. Trend Confirmation:
Confirm the overall market trend before relying on a Bear Flag. This pattern is most reliable in the context of an established downtrend.
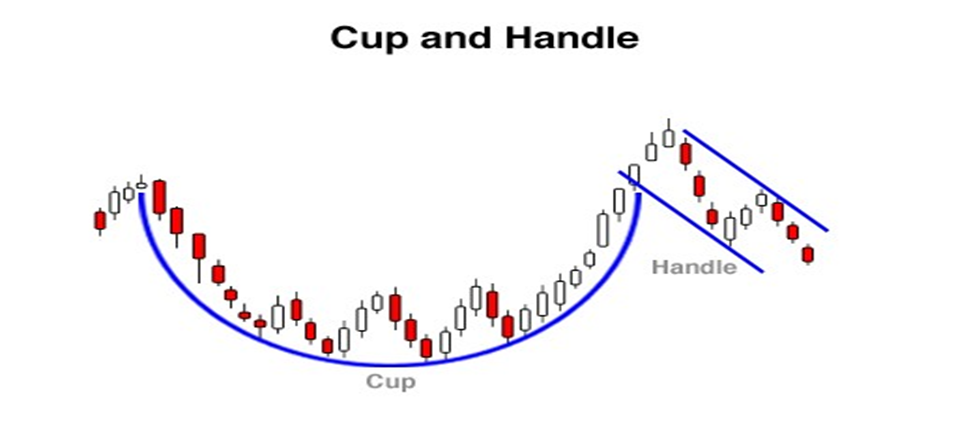
4. Cup and Handle
The Text Book Drawing of the Chart is more like this
The Chart in actual trade may look like this
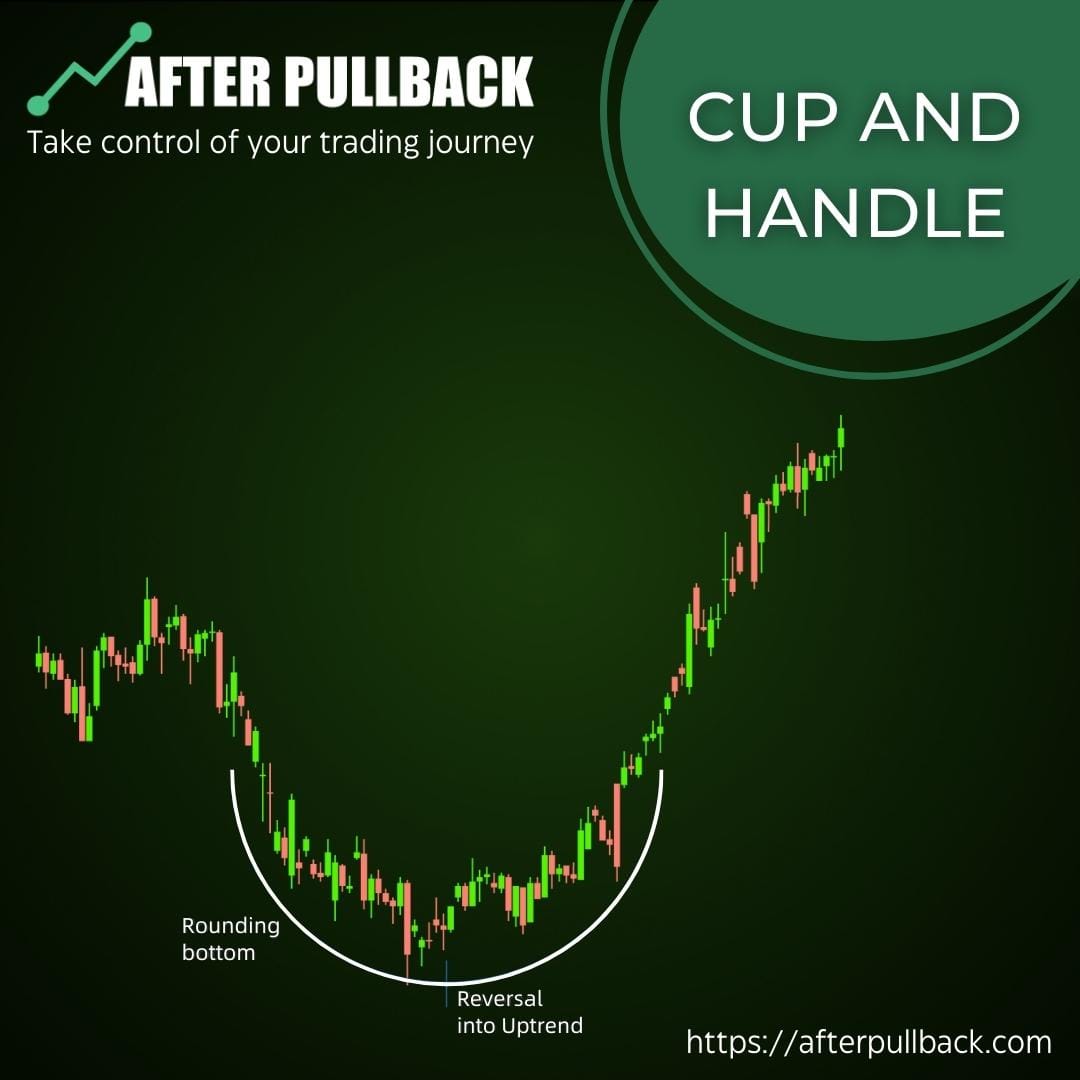
The Cup and Handle is a bullish continuation pattern in technical analysis. It resembles the shape of a teacup, consisting of a rounded bottom (cup) followed by a consolidation period (handle), signalling a potential upward price continuation.
Traders use the Cup and Handle pattern to identify potential buying opportunities in the market. It is especially valuable in recognizing trends that might continue after a brief consolidation.
Components of Cup and Handle:
a. Cup:
The cup forms as prices initially decline and then gradually rise to create a rounded bottom. This phase represents a shift from bearish sentiment to potential bullish momentum.
b. Handle:
After the cup formation, there is a consolidation period known as the handle. This is characterized by a slight downward drift in prices, typically forming a symmetrical or descending triangle.
Entry, Exit, and Target Price of Cup and Handle:
Traders often enter a position when the price breaks above the resistance level formed by the top of the cup. This breakout indicates a potential continuation of the uptrend.
To estimate the target price, measure the distance from the bottom of the cup to the top (handle excluded) and project that distance upward from the breakout point.
Place a stop-loss order below the lowest point of the cup. This helps manage risk in case the pattern does not play out as expected.
Factors to Consider in Cup and Handle:
a. Duration:
Consider the duration of the cup and handle formation. A more extended period may result in a more potent breakout.
b. Volume:
Volume analysis is crucial. During the cup formation, there is often an increase in volume, and during the handle, there is a decrease. Confirming this pattern with appropriate volume levels enhances its reliability.
c. Trend Confirmation:
Confirm the overall market trend before relying on the Cup and Handle. This pattern is most reliable when it occurs in the context of an established uptrend.
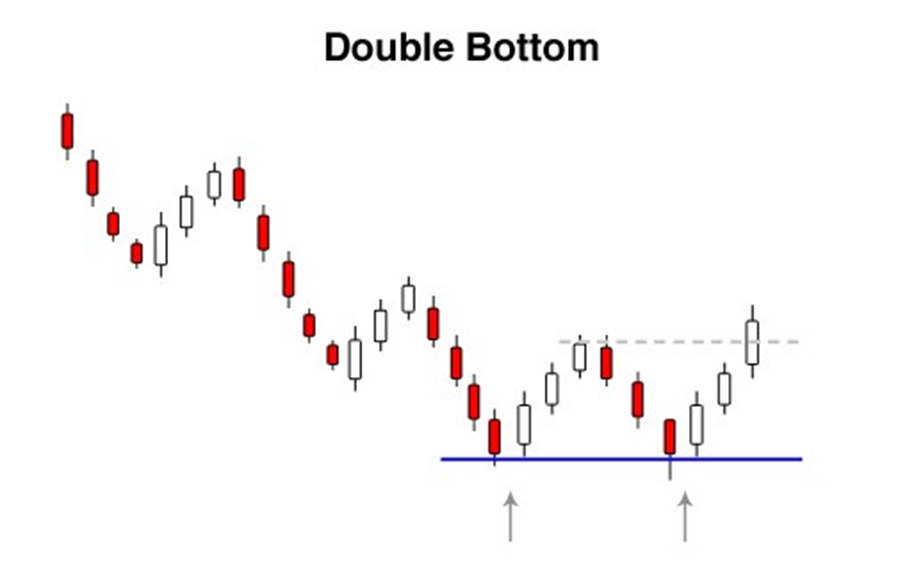
5. Double Bottom:
The Text Book Drawing of the Chart is more like this
Moreover, In Actual, the chart pattern may look like this

The Double Bottom is a bullish reversal pattern in technical analysis. It occurs after a downtrend and is characterized by two consecutive troughs at roughly the same price level, signalling a potential trend reversal from bearish to bullish.
Traders use the Double Bottom pattern to identify potential buying opportunities after a sustained downtrend. The asset may be finding a bottom and is ready for a bullish reversal.
Components of Double Bottom:
The Double Bottom pattern consists of two troughs, often resembling the letter "W." The space between the troughs is called the neckline.
Entry, Exit, and Target Price in Double Bottom:
Traders typically enter a long position when the price breaks above the neckline. This breakout suggests a potential reversal of the downtrend.
To estimate the target price, traders generally measure the distance from the bottom of the double bottom to the neckline and project that distance upward from the breakout point.
Traders Place a stop-loss order slightly below the lowest point between the two troughs. This helps manage risk in case the pattern does not play out as expected.
Factors to Consider in Double Bottom:
a. Duration:
Consider the duration of the double bottom pattern. A more extended period may result in a more potent breakout.
b. Volume:
Volume analysis is crucial. Look for an increase in volume during the formation of the second trough and the breakout. This confirms the strength of the potential reversal.
c. Trend Confirmation:
Confirm the overall market trend before relying on the Double Bottom. This pattern is most reliable when it occurs in the context of an established downtrend.
6. Falling wedge
The Text Book Drawing of the Chart is more like this
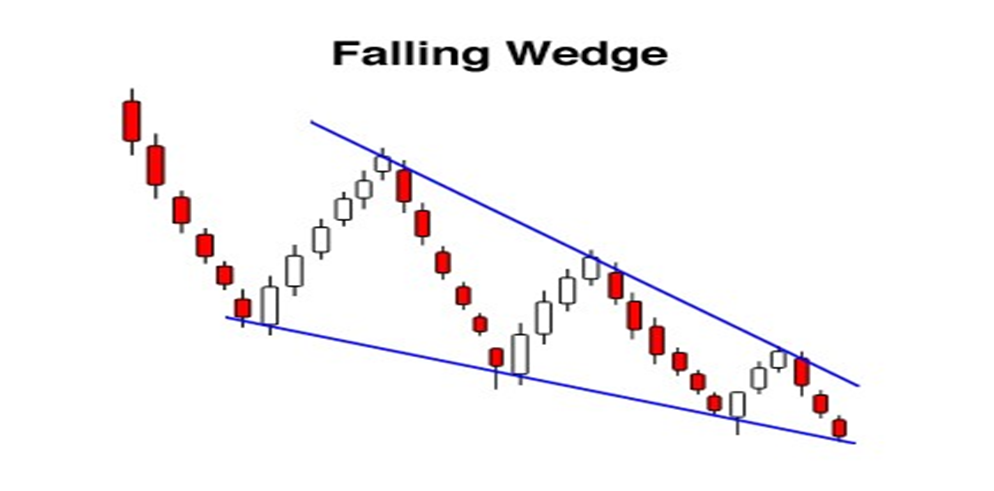
While Actual Chart Pattern looks like this !

The Falling Wedge is a bullish continuation pattern in technical analysis. It is characterized by converging trendlines that slope downward, creating a wedge shape. Despite the name, it often leads to a bullish reversal or continuation.
Traders use the Falling Wedge pattern to identify potential buying opportunities within an existing downtrend. It signals that the selling pressure is diminishing, and a possible bullish reversal may occur.
Components of Falling wedge:
The Falling Wedge pattern consists of two converging trendlines, where the upper trendline slopes downward at a steeper angle than the lower trendline.
Entry, Exit, and Target Price in Falling wedge:
Traders typically enter a long position when the price breaks above the upper trendline of the wedge. This breakout suggests a potential reversal or continuation of the existing downtrend.
To estimate the target price, Traders measure the height of the widest part of the wedge and project that distance upward from the breakout point.
They also place a stop-loss order below the lower trendline of the wedge. This helps manage risk in case the pattern does not play out as expected.
Factors to Consider in Falling wedge:
a. Duration:
Consider the duration of the falling wedge pattern. A more extended period may result in a more potent breakout.
b. Volume:
Volume analysis is crucial. Look for an increase in volume during the formation of the falling wedge and a noticeable surge on the breakout. This confirms the strength of the potential reversal.
c. Trend Confirmation:
Confirm the overall market trend before relying on the Falling Wedge. This pattern is most reliable when it occurs in the context of an established downtrend.
7. Double Top:
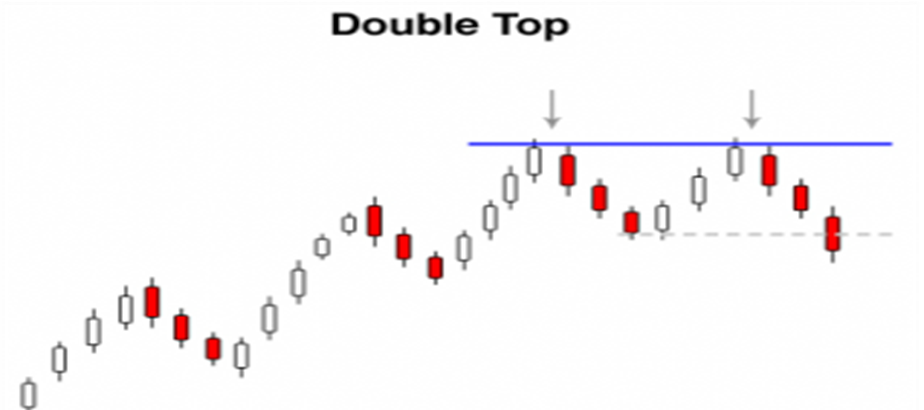
The Text Book Drawing of the Chart is more like this
While in Actual Chart Patterns may look like this
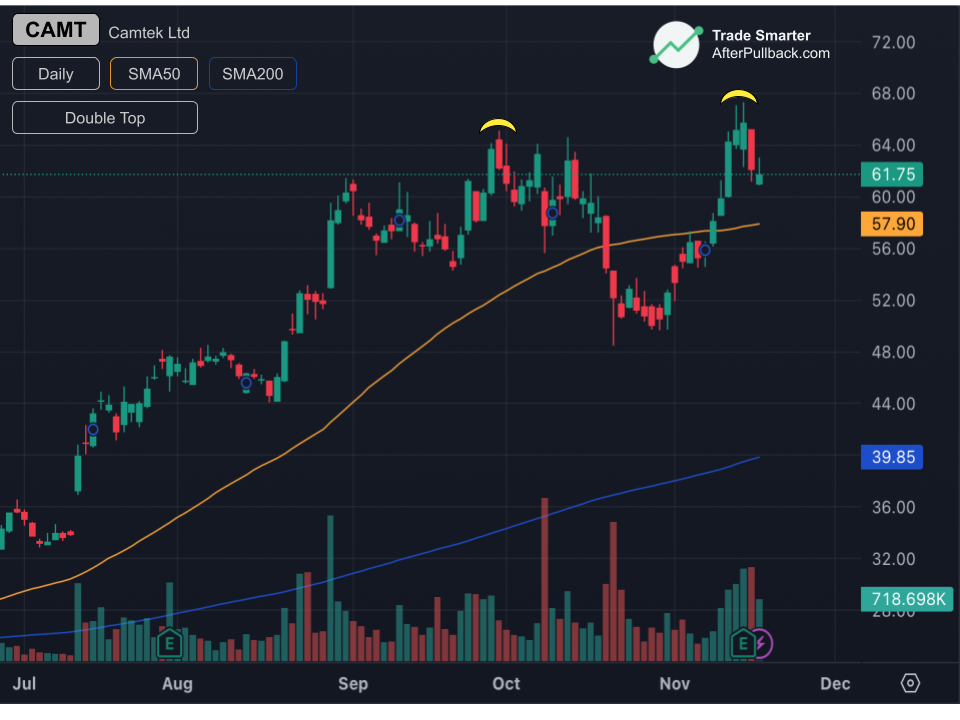
The Double Top is a bearish reversal pattern. It occurs after an uptrend and is characterized by two peaks at roughly the same price level, separated by a trough. The pattern suggests a potential reversal from bullish to bearish.
Traders use the Double Top pattern to identify potential selling opportunities after a sustained uptrend. It signals that the asset may be reaching a top, and a bearish reversal might be imminent.
Components of Double Top:
The Double Top pattern consists of two peaks, often resembling the letter "M." The space between the peaks is called the neckline.
Entry, Exit, and Target Price in Double Top:
Traders typically enter a short position when the price breaks below the neckline. This breakout suggests a potential reversal of the uptrend.
To estimate the target price, Traders measure the distance from the top of the double canopy to the neckline and project that distance downward from the breakout point.
They also Place a stop-loss order slightly above the highest point between the two peaks. This helps manage risk in case the pattern does not play out as expected.
Factors to Consider in Double Top:
a. Duration:
Consider the duration of the double-top pattern. A more extended period may result in a more potent breakout.
b. Volume:
Volume analysis is crucial. Look for an increase in volume during the formation of the second peak and the breakout. This confirms the strength of the potential reversal.
c. Trend Confirmation:
Confirm the overall market trend before relying on the Double Top. This pattern is most reliable when it occurs in the context of an established uptrend.
8. Head & Shoulders
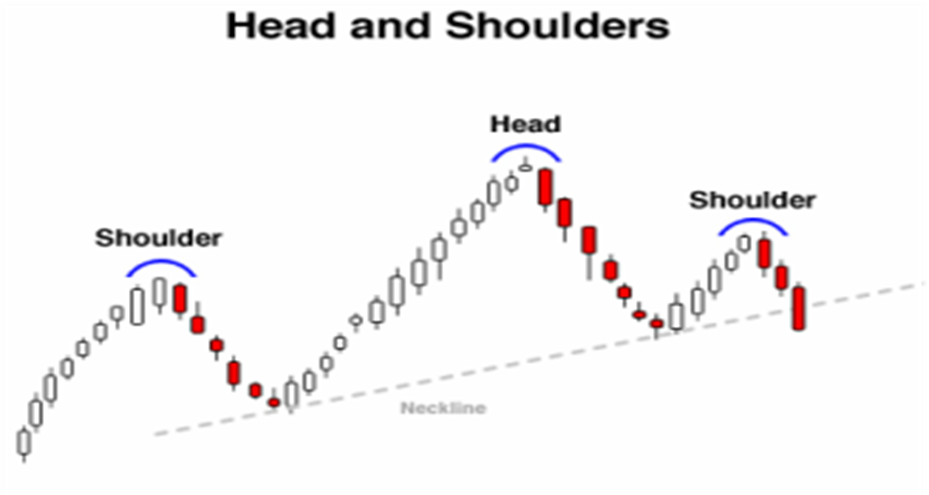
The Text Book Drawing of the Chart is more like this
While in actual , the Chart Pattern looks like this
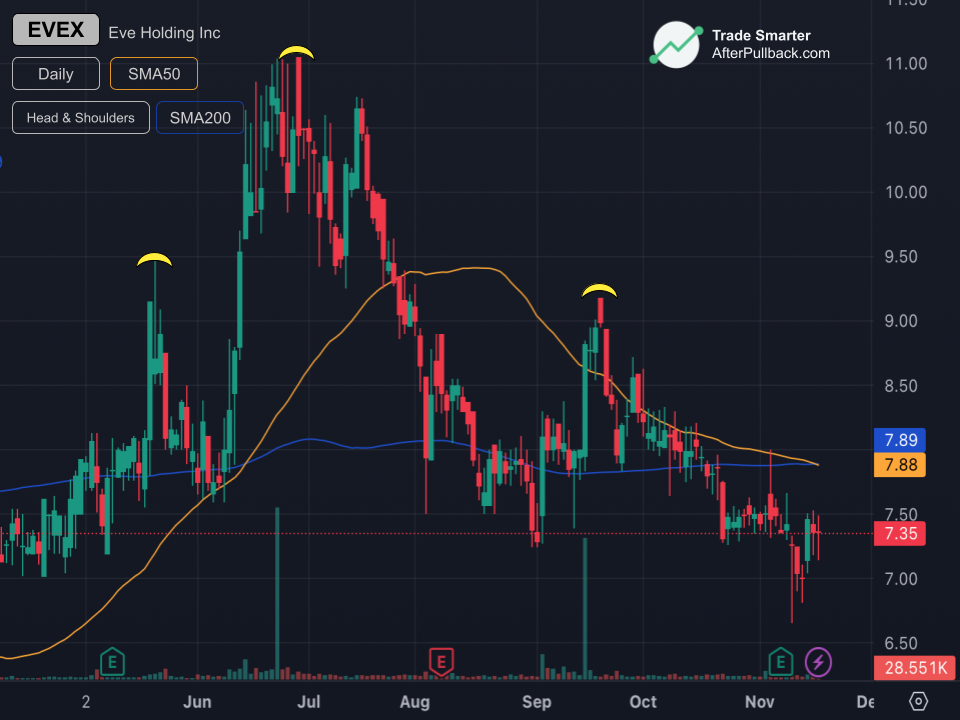
The most widely known pattern among the traders, The Head and Shoulders, is a bearish reversal pattern. It is characterized by three peaks: a higher peak (head) between two lower peaks (shoulders). The pattern signals a potential trend reversal from bullish to bearish.
Traders use the Head and Shoulders pattern to identify potential selling opportunities after a sustained uptrend. The asset may be reaching a peak, and a bearish reversal may be imminent.
Components of Head & Shoulders:
The Head and Shoulders pattern consists of three peaks: a higher peak in the middle (head) and two lower peaks on either side (shoulders). The trough between the head and shoulders forms a neckline.
Entry, Exit, and Target Price with Head & Shoulders:
Traders typically enter a short position when the price breaks below the neckline. This breakout suggests a potential reversal of the uptrend.
To estimate the target price, they measure the distance from the head to the neckline and project that distance downward from the breakout point.
Traders also place a stop-loss order slightly above the head, the highest point of the pattern. This helps manage risk in case the pattern does not play out as expected.
Factors to Consider in Head & Shoulders:
a. Duration:
Consider the duration of the Head and Shoulder pattern. A more extended period may result in a more potent breakout.
b. Volume:
Volume analysis is crucial. Look for an increase in volume during the formation of the head and shoulders and the breakout. This confirms the strength of the potential reversal.
c. Trend Confirmation:
Confirm the overall market trend before relying on the Head and Shoulders. This pattern is most reliable when it occurs in the context of an established uptrend.
9. Rising Wedge:
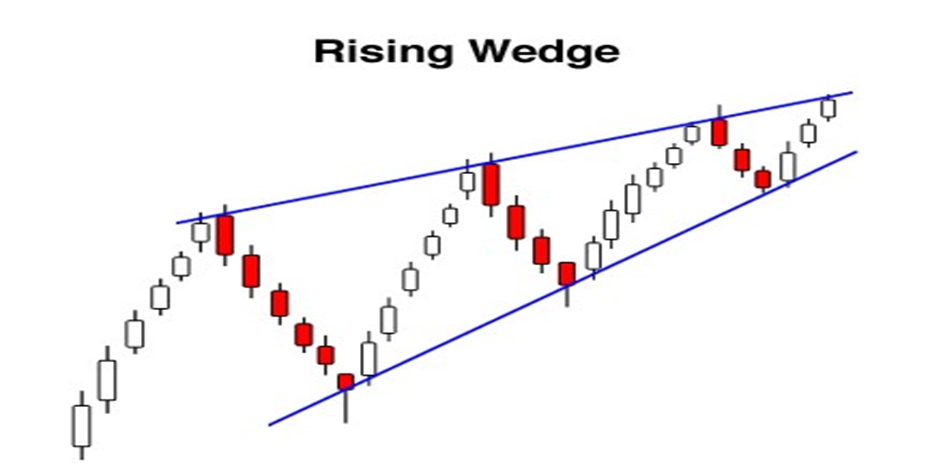
The Text Book Drawing of the Chart is more like this
While in Actual , the chart may look like this

The Rising Wedge is a bearish reversal pattern. It is characterized by converging trendlines that slope upward, creating a wedge shape. Despite the name, it often leads to a bearish reversal or continuation.
Traders use the Rising Wedge pattern to identify potential selling opportunities within an existing uptrend. It signals that the buying pressure is diminishing, and a possible bearish reversal may occur.
Components of Rising Wedge:
The Rising Wedge pattern consists of two converging trendlines, where the lower trendline slopes upward at a steeper angle than the upper trendline.
Entry, Exit, and Target Price in Rising Wedge:
Traders typically enter a short position when the price breaks below the lower trendline of the wedge. This breakout suggests a potential reversal or continuation of the existing uptrend.
To estimate the target price, They generally measure the height of the widest part of the wedge and project that distance downward from the breakout point.
Cautious traders also place a stop-loss order above the upper trendline of the wedge. This helps manage risk in case the pattern does not play out as expected.
Factors to Consider with Rising Wedge:
a. Duration:
Consider the duration of the rising wedge pattern. A more extended period may result in a more potent breakout.
b. Volume:
Volume analysis is crucial. Look for an increase in volume during the formation of the rising wedge and a noticeable surge on the breakout. This confirms the strength of the potential reversal.
c. Trend Confirmation:
Confirm the overall market trend before relying on the Rising Wedge. This pattern is most reliable when it occurs in the context of an established uptrend.
10. Inverted Cup and Handle:
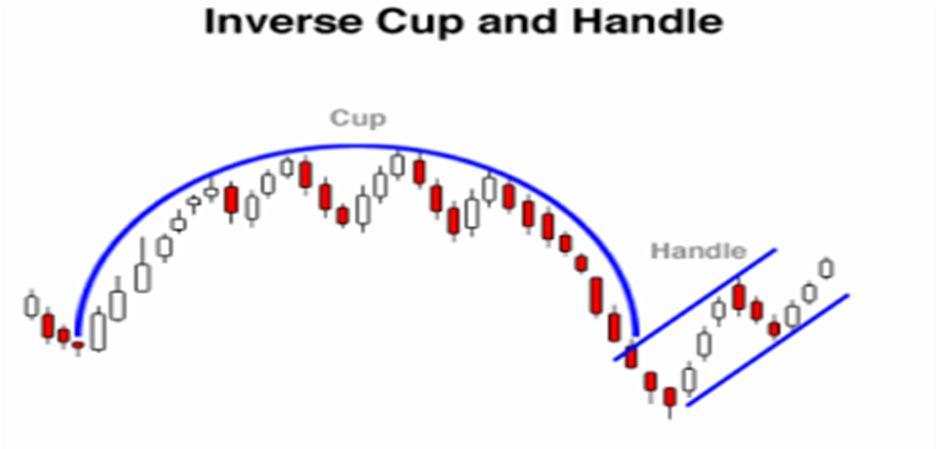
The Inverted Cup and Handle is a bearish reversal pattern. It is the opposite of the traditional Cup and Handle, consisting of an upside-down cup (inverted cup) followed by a consolidation period (handle), signalling a potential downward price reversal.
Traders use the Inverted Cup and Handle pattern to identify potential selling opportunities in the market. It is especially valuable in recognizing trends that might reverse after a brief consolidation.
Components of Inverted Cup and Handle:
a. Inverted Cup:
The inverted cup forms as prices initially rise and then gradually decline to create a rounded top. This phase represents a shift from bullish sentiment to potential bearish momentum.
b. Handle:
After the inverted cup formation, there is a consolidation period known as the handle. This is characterized by a slight upward drift in prices, typically forming a symmetrical or ascending triangle.
Entry, Exit, and Target Price in Inverted Cup and Handle:
Traders often enter a short position when the price breaks below the support level formed by the bottom of the inverted cup. This breakout indicates a potential continuation of the downtrend.
To estimate the target price, measure the distance from the top of the inverted cup to the bottom (handle excluded) and project that distance downward from the breakout point.
Place a stop-loss order above the highest point of the inverted cup. This helps manage risk in case the pattern does not play out as expected.
Factors to Consider with Inverted Cup and Handle:
a. Duration
Consider the duration of the inverted cup and handle formation. A more extended period may result in a more potent breakout.
b. Volume:
Volume analysis is crucial. During the inverted cup formation, there may be an increase in volume, and during the handle, there is often a decrease. Confirming this pattern with appropriate volume levels enhances its reliability.
c. Trend Confirmation:
Confirm the overall market trend before relying on the Inverted Cup and Handle. This pattern is most reliable when it occurs in the context of an established downtrend.
This bring us to the end of our list , but before we go, here is a
A Word of Caution!
As with any technical analysis, it's crucial to use these Chart Patterns in conjunction with other indicators and analysis methods for well-informed trading decisions.
Trade Smarter!


