When does a trade setup have a higher chance of Success?
Imagine a single strand of spaghetti—it's easily broken. But weave multiple strands together, and you have strong, flexible pasta. Similarly, a trading strategy with just one factor is fragile. But a similar trade setup will have a higher chance of success if it aligns with several factors.
- It is showing a strong trend.
- Technical Indicators support the Trend.
- It's further validated by Support and resistance level
- It has the right balance of volatility
- Relevant News and events can also act as a catalyst for the trade.
In the blog post below, we will discuss how each of these factors contributes to the overall success of the trade setup.
So, Let's go!
1) Riding the Trend:
A trade in the direction of a prevailing trend is more likely to succeed than a trade against the Trend.
Similar to bodyboarding down a massive ocean wave, Trends act as powerful forces that can significantly influence price movements. A high-probability trade setup leverages this inherent momentum by aligning your entry with the prevailing trend direction.
As you had seen in our previous blog, Trends can boost your trading performance significantly,
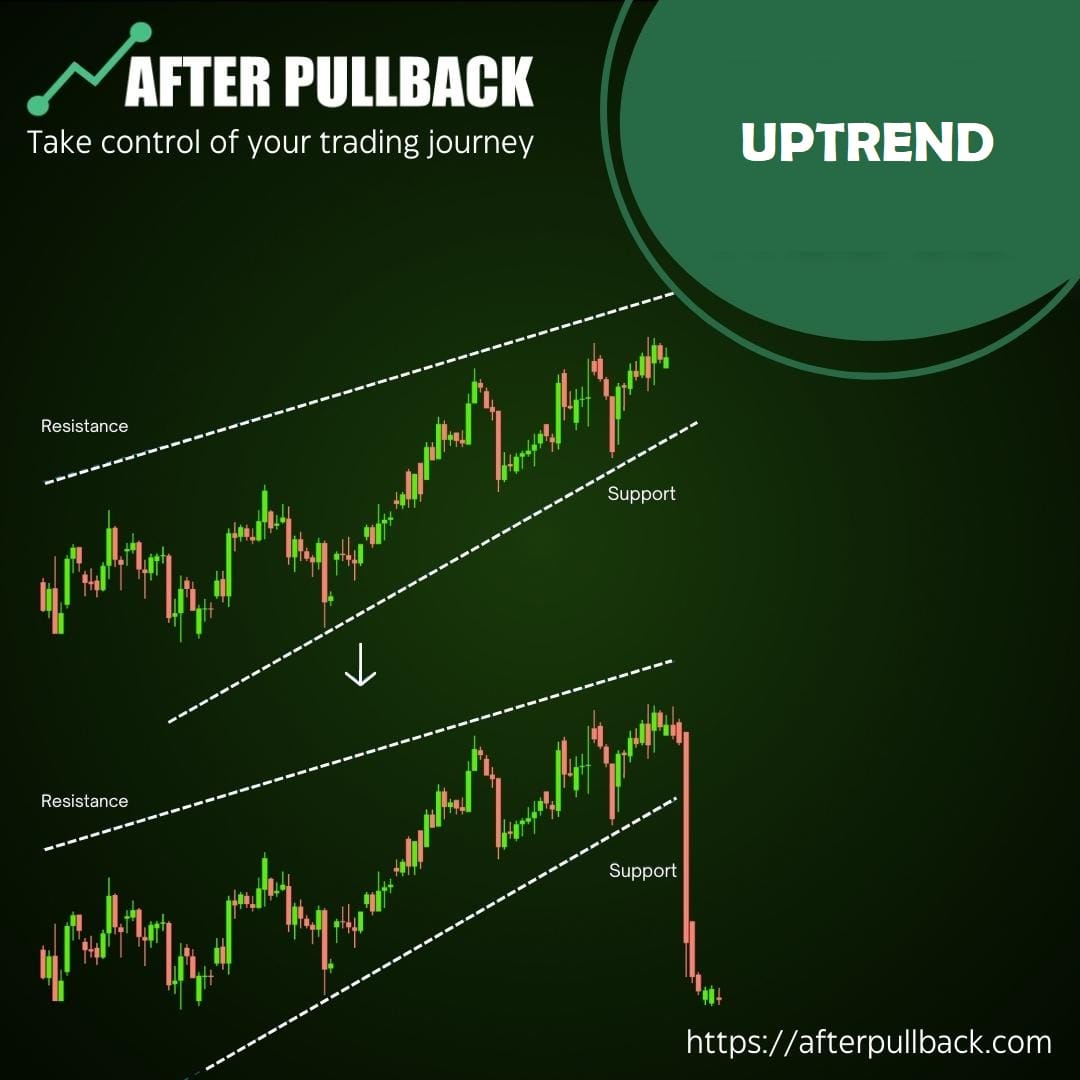
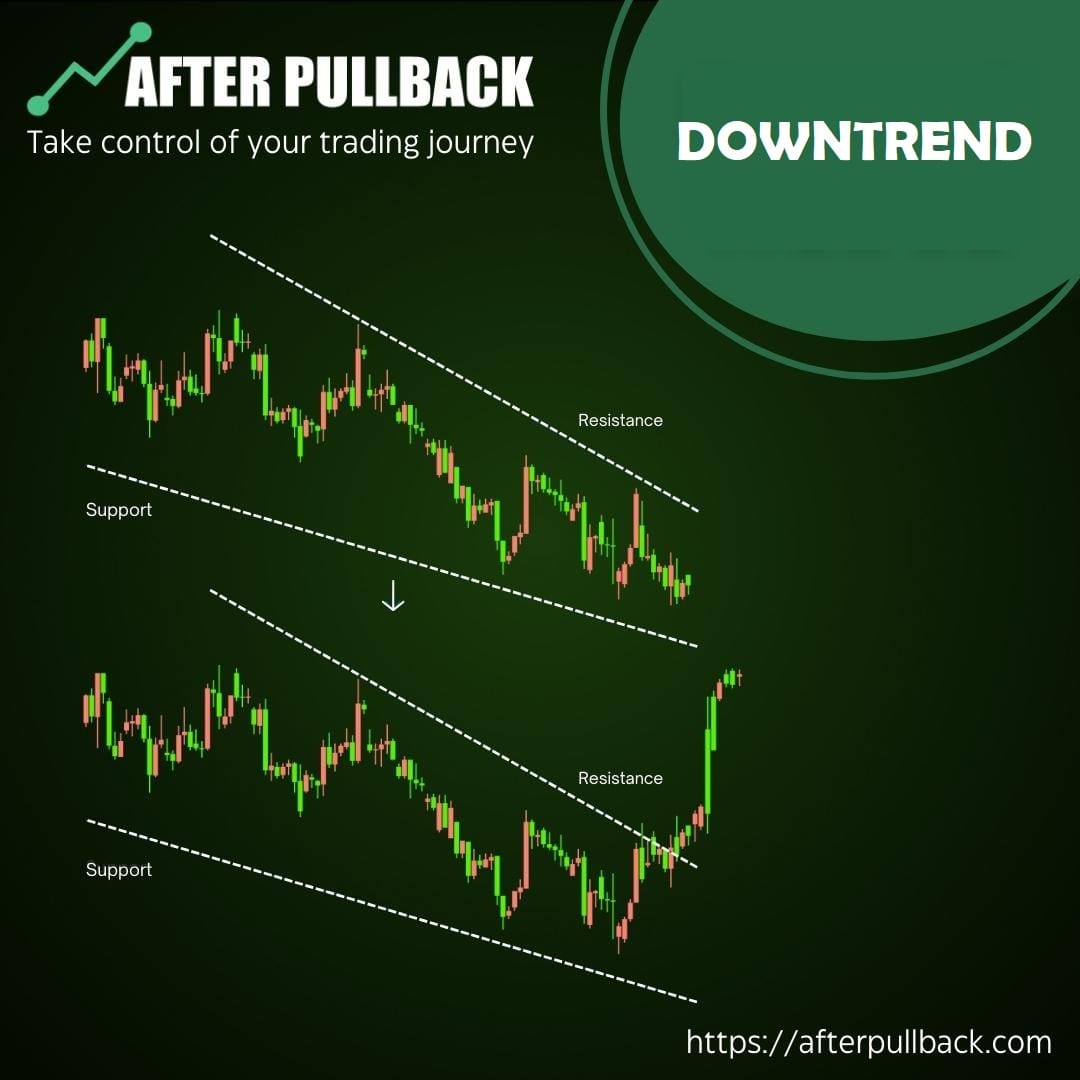
It's because markets don't move randomly. Prices tend to exhibit trends, either upwards (uptrend), downwards (downtrend), or sideways (consolidation). Established trends, characterized by a series of higher highs and higher lows (uptrend) or lower lows and lower highs (downtrend), indicate a dominant force driving prices in a specific direction.
Also,
Trends Capitalize on Momentum
By entering a trade in the Trend's direction, Trend aligns itself with the prevailing market sentiment. This momentum can act like a tailwind, potentially propelling your trade further in the profitable direction. For instance, buying in an uptrend increases your chances of profiting as the overall trend prices increase. Conversely, entering a short position (selling) in a downtrend allows you to benefit from the market's downward pressure potentially.
So, By riding a trend, you are essentially
Reducing the Risk and Increasing Potential Reward
This is because trading against the Trend is considerably riskier. Imagine paddling against the current—an uphill battle requiring significant effort. When you enter a trade against the Trend, you are essentially betting on a reversal of the established momentum. This can be successful, but the odds are stacked against you. High-probability setups focus on identifying the Trend and capitalizing on its continuation, offering a more favorable risk-reward profile.
2) Support by Technical Indicators
The convergence of multiple technical indicators supporting your entry point can strengthen your confidence in the trade setup.
It's Just like gathering and analyzing evidence from multiple sources to build a strong case,
Similarly, technical indicators in trading act as individual pieces of evidence, each offering a unique perspective on the market. High-probability trade setups don't rely on a single indicator's hunch but rather a symphony of indicators playing unison to support your entry point.
And why do you call it a symphony?
Because it's like an orchestra where each individual instrument should align for the perfect music.

Technical indicators are mathematical calculations applied to historical price and volume data, aiming to identify potential trends, reversals, and areas of support/resistance.
Indicators like Moving Averages smooth out price fluctuations, revealing the underlying Trend. A Trend upward-sloping moving average suggests an uptrend, while a downward-sloping one indicates a downtrend. They can also identify potential support and resistance levels when the price repeatedly bounces off the moving average line.
Similarly,
Indicators like the Relative Strength Index (RSI) measure the market's relative strength or weakness by considering recent price movements. An RSI value above 70 suggests the market might be overbought (ripe for a pullback), while a value below 30 indicates it might be oversold (potentially due for a bounce). This can help you identify potential entry points within established trends.
And,
Based on a standard deviation, Bollinger Bands creates a channel around the price chart. As volatility increases, the bands widen, and vice versa. A price breakout above the upper Bollinger Band® might suggest intense buying pressure, while a breakout below the lower band could indicate selling pressure. This can help you identify potential trend continuations or reversals.
How is the convergence of all indicators key?
You see, a single indicator's signal can be like a hunch—intriguing but not always definitive. High-probability setups focus on convergence, where multiple indicators with different functionalities suggest the same thing.
For instance, imagine an uptrend with:
- A rising price chart.
- A 50-day moving average is sloping upwards.
- An RSI value is around 50, indicating the market is neither overbought nor oversold.
This confluence of evidence strengthens your confidence that the uptrend will continue, making it a potentially high-probability trade setup.
3) Support and Resistance Levels
We all know that Buying near support levels in an uptrend or selling near resistance levels in a downtrend can indicate potential turning points in price.
High-probability trade setups leverage these levels to identify potential entry points that could lead to profitable trades.
Support represents a price zone where buyers tend to step in and prevent further price declines. Conversely, resistance indicates a level where sellers often emerge, halting price advances.
High-probability setups focus on entering trades advantageously using support and resistance. Imagine an established uptrend. As the price approaches a support level, entering a long position (buy) might be a good opportunity. The support zone is expected to hold, and the price will resume its upward trajectory. Conversely, a high-probability setup might involve entering a short position (sell) in a downtrend nearing a resistance level. The anticipation here is that the resistance will hold, and the price will continue its downward move.
But always remember,
These are not Just Lines But Zones!
It's important to remember that support and resistance aren't single price points but zones. These zones can be wider or narrower depending on the chart's time frame and the market's volatility. High-probability setups focus on entering trades within these zones, allowing for some price fluctuations before the anticipated move occurs.
4) Volatility in high probability Trade Setup
Volatility refers to the extent and speed of price changes in a security, like a stock or an index.
Once your price action scanner has identified volatility, you can essentially measure how "jittery" or unpredictable the price movement is.
Lower-than-usual volatility can indicate a period of consolidation, where the price is confined to a relatively narrow range. This consolidation phase can sometimes precede a robust directional move as buyers and sellers gather their forces.
High-probability setups involve identifying these consolidation zones and entering trades anticipating a breakout, where the price decisively moves in one direction.
But it's only sometimes like that.
While consolidation can precede a strong move, it's important to remember it doesn't always guarantee one. Periods of low volatility can also lead to extended periods of sideways movement, offering little opportunity for profitable trades. Therefore, high-probability setups shouldn't rely solely on low volatility. Look for confirmation from other technical indicators suggesting a potential breakout before entering a trade.
On the other hand,
Unusually high volatility can indicate a period of increased market uncertainty. This can happen due to significant news events, economic data releases, or heightened investor anxiety.
While volatility can create opportunities for short-term traders, it also makes identifying clear trends more challenging for high-probability setups. The rapid price swings associated with high volatility can lead to false signals and unexpected reversals.
So, In Essence,
You have to find that “Sweet Spot” of Volatility.

High-probability setups often seek a balance in volatility. Ideally, you want enough volatility to facilitate price movement but not so much that the trend direction becomes obscured. By understanding how to interpret volatility levels and combining them with other technical analyses, you can identify potential entry points where the risk-reward profile is more favorable.
5) News and Events
The world doesn't exist in a vacuum, and neither does the stock market.
Major news events or economic data releases can significantly impact prices. Understanding these factors and their potential influence is crucial.
It's because today's Financial markets are information-driven ecosystems. Investors constantly analyze and react to news and economic data releases. Positive News, such as strong economic growth figures or a surprise interest rate cut, can trigger buying pressure, leading to price increases. Conversely, negative News, like disappointing employment data or a political crisis, can cause investors to sell their holdings, resulting in price declines.
How News Impacts Prices:
Investor Psychology: News can trigger emotional responses from investors, leading to buying or selling decisions based on fear, optimism, or a combination of both.
Discounted Cash Flow: News can affect investors' perception of a company's future earnings potential. For example, positive News might lead them to revise their estimates upwards, justifying a higher stock price.
Risk Perception: News events can alter investors' perception of risk. For instance, News about an economic slowdown might increase risk aversion, leading them to sell stocks and move towards safer investments.
Irrespective of the impact, the point here to note is.
In the News, Anticipation is Key!
You see, high-probability trade setups don't just react to News after it hits the market. They are involved in anticipating how the market might respond to upcoming events. By keeping an eye on the economic calendar and major news headlines, you can identify potential catalysts that could significantly impact the price of the assets you're trading.
Summing It All Up: A Detailed Example
Let's say we're looking at a technology stock (XYZ) that's been in a strong uptrend for the past year. However, the price action has been choppier in the last month, with a few pullbacks.
Trend: The overall Trend is based on higher highs and lows on the yearly chart, but the monthly chart shows a recent consolidation phase.
Technical Indicators: The RSI is currently at 55, indicating the stock is neither overbought nor oversold. However, the MACD recently had a bearish crossover, suggesting some loss of momentum.
Support and Resistance: A well-defined support level at $100 has been held twice during the uptrend. The price recently dipped towards this level but only managed a weak bounce. There's also a resistance level at $120 that the stock struggled to overcome twice before the consolidation phase.
Volatility: The ATR indicator shows slightly increased volatility compared to the previous months.
News Impact: There is no major company-specific news, but some general economic uncertainty is causing a market-wide pullback.
Trade Setup: This is where things get more complex. Here are two possible approaches:
Approach 1: Conservative Long Entry with Confirmation:
Wait for Confirmation: Given the mixed signals and increased volatility, we might decide to wait to confirm the uptrend before entering a long position.
Confirmation Signal: This confirmation could come in the form of a strong bounce off the $100 support level, a bullish crossover on the MACD, or positive News about the company or the tech sector.
Entry: Once confirmed, we could enter a long position around $105, just above the support level.
Stop-loss: To limit losses if the price breaks down decisively, the stop-loss could be placed below the support level, say at $95.
Target: The profit target could be the previous resistance level of $120 or even higher, depending on the strength of the confirmation and the overall market sentiment.
Approach 2: Short-Term Swing Trade:
Instead of taking the conservative trade, We could also take advantage of the potential bounce off the support level for a short-term swing trade.
Entry: Enter a long position at around $102.50, betting on a bounce-off support.
Stop-Loss: The stop-loss could be placed just below the support level, say at $99.
Target: The profit target could be a predefined percentage gain (e.g., 5%) or the recent high before the pullback (around $108). This would capture the potential bounce without risking too much if the uptrend doesn't hold.
Why These Might Be Profitable:
Both approaches have a chance of profitability depending on how the market plays out. The conservative approach prioritizes minimizing risk and waiting for a clear confirmation before entering. The swing trade approach aims to capitalize on a potential short-term bounce within the larger
Trend.
Final Remarks!
Now you've got the recipe for a potentially successful trade! By looking for these five factors together—Trend, technical indicators, support and resistance, volatility, and relevant News—you can increase your chances of finding trades that have a higher chance of winning. Remember, the market can be unpredictable, so always manage your risk. With this knowledge, you're well on your way to becoming a more informed trader!
Trade Smarter!


