What is Reversal Trading & How to Spot Reversal Opportunities

What is Reversal Trading?
Reversal trading is a strategy employed by traders who seek to profit from a change in the direction of a market's trend. It involves identifying potential turning points in the market and entering trades that anticipate the reversal.
What is the Difference between a Pullback and Reversal?
Pullback and reversal are terms often used in technical analysis to describe price movements. While they might seem similar, there's a crucial distinction between them.
A pullback is a temporary decline in price against the prevailing trend. It's essentially a short-term pause or correction within the overall trend direction.
A reversal is a significant change in the direction of a trend. It marks a shift from an uptrend to a downtrend, or vice versa.
How to Spot Reversal?
The bad news is
There's no foolproof method to predict reversals,
The Good news is.
There are some common indicators that can predict reversals.
These Methods include the use of chart patterns and then taking confirmation from some technical indicators
In the blog post below, we will discuss those methods
Identification of Reversal through Chart Patterns
We will be discussing the three most common chart patterns to identify the trend reversal;
1) Identification of Reversal through Head and Shoulders Chart Pattern:
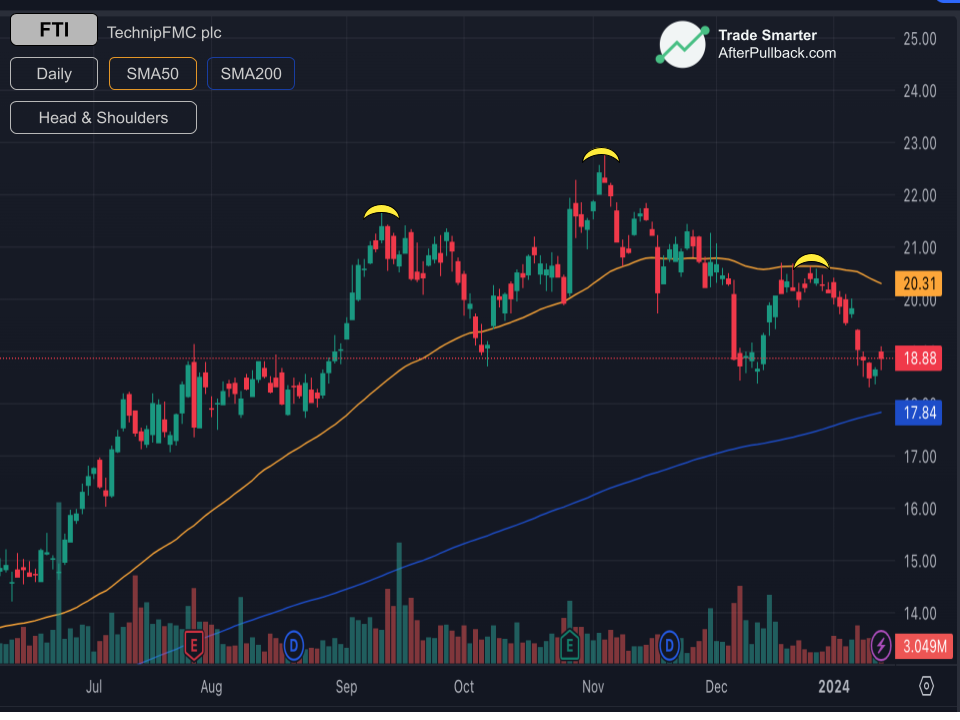
A head and shoulders pattern is a technical analysis chart formation often signaling a potential reversal in a trend. It consists of three distinct peaks:
The Left Shoulder is the first peak, typically lower than the central peak. The Head is the highest peak, representing the market's maximum price before a reversal. The right shoulder is The second peak, usually lower than the head.
The Psychology of Buyers and Sellers in Head & Shoulder Pattern
The head and shoulders pattern provides valuable insights into the psychology of buyers and sellers.
It's a narrative of buyers pushing harder for the price, trying three times, failing each time, and ultimately accepting defeat, leading to a price decline below the neckline.
The Left Shoulder represents buyers initially gaining momentum, pushing the price higher. However, as the price peaks, buying pressure may wane, indicating a potential exhaustion of bullish sentiment.
The Head shows a renewed burst of buying interest, possibly driven by factors such as positive news or technical indicators. However, the head often represents a significant resistance level, and buyers may struggle to increase prices.
The right Shoulder is a weakening of bullish sentiment. Sellers may be becoming more active, pushing the price lower. If the price breaks below the neckline, it suggests that sellers have overcome the resistance and are gaining control.
How to Enter and Exit a trade using Head & shoulder pattern?
Traders generally draw A Neckline connecting the lows between the left shoulder, head, and right shoulder. When the price breaks below the neckline (in a downtrend) or above the neckline (in an uptrend), it indicates a potential reversal.
Entry Points
Neckline Breakout: The primary entry point is typically when the price breaks below the neckline in a downtrend or above the neckline in an uptrend. This confirms the reversal signal.
Retest of the Neckline: After the initial breakout, the price might retest the neckline. If the price fails to break back through the neckline, it can strengthen the reversal signal and provide a potential re-entry opportunity.
Exit Points
A common profit target is calculated by measuring the distance from the head to the neckline and projecting it in the direction of the reversal. For example, if the pattern indicates a bearish reversal, the target would be the distance from the head to the neckline projected downward from the breakout point.
2) Identification of Reversal through Triangle Chart Patterns
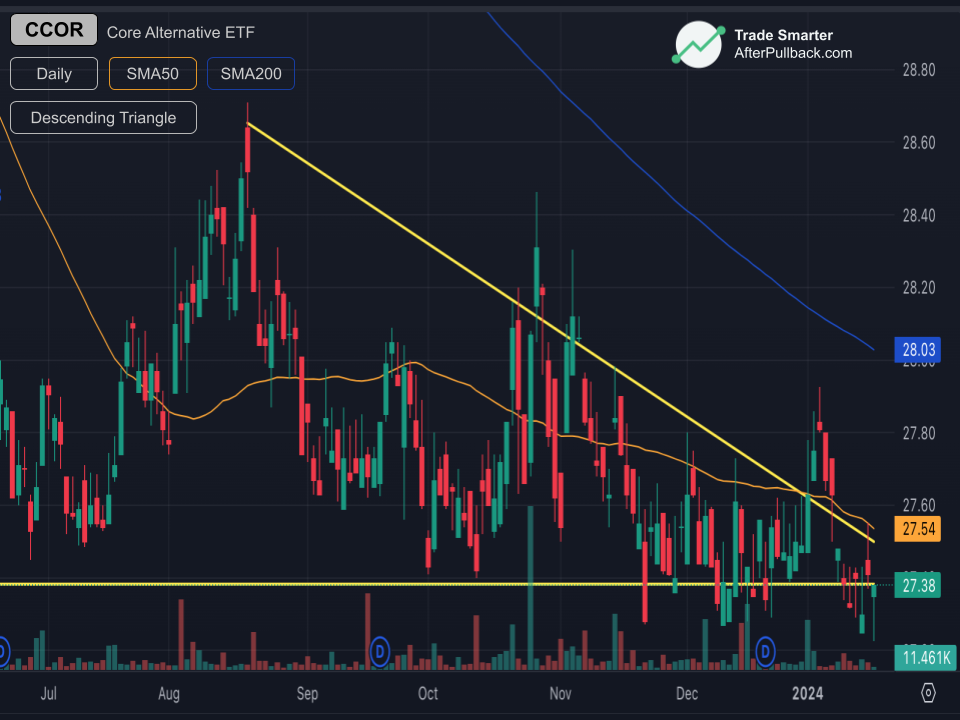
Triangles in technical analysis are chart patterns that form when price action converges into a triangular shape. They are often used to identify potential reversals or continuations of trends.
Two most common types of triangles are
Ascending Triangle: This triangle has a horizontal upper trendline and a rising lower trendline. A breakout above the upper trendline often signals a bullish reversal.
Descending Triangle: This triangle has a horizontal lower trendline and a falling upper trendline. A breakdown below the lower trendline often signals a bearish reversal.
Why Triangles Often Indicate Reversals?
Because of Indecision
Yes, Triangles often represent a period of indecision between buyers and sellers. As the price range narrows, both sides are struggling to gain control, leading to a potential reversal.
Triangles also represent Exhaustion. The narrowing price range can also indicate that market participants are becoming exhausted. After a prolonged trend, buyers or sellers may be losing momentum, making a reversal more likely.
When to enter and exit the trade using triangle patterns?
To effectively trade based on triangle patterns, it's crucial to understand the appropriate timing for entering and exiting positions.
Entry Points
Breakout: The primary entry point is typically when the price breaks out of the triangle. This can be either a breakout above the upper trendline (in an ascending or symmetrical triangle) or a breakdown below the lower trendline (in a descending or symmetrical triangle).
Retest: After the initial breakout, the price might retest the broken trendline. If the price fails to break back through the trendline, it can strengthen the reversal signal and provide a potential re-entry opportunity.
Exit Points
A common profit target is calculated by measuring the height of the triangle (the distance between the upper and lower trendlines at the widest point) and projecting it in the direction of the breakout.
3) Identification of Reversal through Flags Chart Patterns
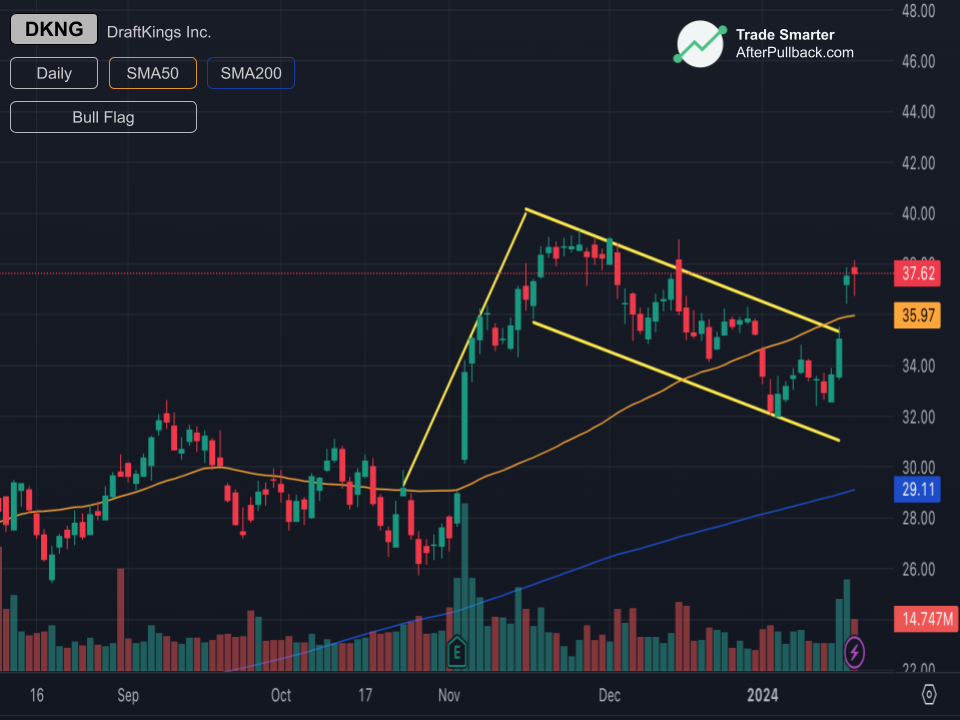
Flags are a technical analysis chart pattern that typically follows a sharp move in price. They are characterized by a rectangular-shaped consolidation pattern, often resembling a flag waving in the wind.
Flags can be;
Bullish Flag. This occurs after a strong uptrend. The price forms a rectangular consolidation pattern, with the upper and lower trendlines roughly parallel. A breakout above the upper trendline of the flag suggests a continuation of the uptrend.
Or
Bearish Flag: This occurs after a strong downtrend. The price forms a rectangular consolidation pattern, with the upper and lower trendlines roughly parallel. A breakdown below the lower trendline of the flag suggests a continuation of the downtrend.
What is the Psychology Behind Flag Formations?
Flag formations often reflect a period of market indecision or consolidation following a strong trend. This indecision can arise from various psychological factors:
The foremost reason is Profit-Taking. After a significant price move, traders may take profits, leading to a temporary pause in the trend. This profit-taking can create a period of consolidation, forming the flag pattern.
Flags can also form due to Fear of Missing Out (FOMO). As the price consolidates, some traders may fear missing out on further gains or losses, leading them to remain on the sidelines. This hesitation can contribute to the formation of a flag.
The flag can also represent a test of support or resistance levels. If the price consolidates near a previous support or resistance level, it may indicate that traders are hesitant to break through that level.
How to Identify Reversal Opportunities with Flags?
Flags are a valuable tool for identifying potential continuations of trends or reversals.
Entry Points
Breakout: The primary entry point is typically when the price breaks out of the flag. This can be either a breakout above the upper trendline (in a bullish flag) or a breakdown below the lower trendline (in a bearish flag).
Retest: After the initial breakout, the price might retest the broken trendline. If the price fails to break back through the trendline, it can strengthen the continuation signal and provide a potential re-entry opportunity.
Exit Points
A common profit target is calculated by measuring the distance from the pole (the initial sharp move in price) to the flag and projecting it in the direction of the breakout.
Additional Confirmation for Reversal Trading
Ok,
SO you have identified the chart pattern and you are about to enter into the market,
But wait
Confirmation is always essential before entering or exit the trade.
How to do this confirmation?
Well, there are a couple of ways, like
Use Moving Averages to confirm the Reversal
By comparing the price of an asset to its moving average, traders can identify potential support or resistance levels and gauge the strength of a trend.
Which Moving average to use ?
Shorter-term moving averages, such as the 50-day or 200-day moving average, are often used for identifying short-term trends and reversals. Longer-term moving averages, such as the 200-day or 400-day moving average, can be used to identify longer-term trends and potential major reversals.
How Moving Averages Can Confirm Reversals
- Crossovers: When a short-term moving average crosses below a longer-term moving average (a "death cross"), it can signal a potential bearish reversal. Conversely, when a short-term moving average crosses above a longer-term moving average (a "golden cross"), it can signal a potential bullish reversal.
- Price Action: If the price is consistently below a moving average and then starts to move above it, it could indicate a bullish reversal. Similarly, if the price is consistently above a moving average and then starts to move below it, it could indicate a bearish reversal.
- Divergence: Divergence occurs when the price and a moving average are moving in opposite directions. For example, if the price is making a new high, but the moving average is failing to make a new high, it could indicate a bearish divergence and a potential reversal.
- Support and Resistance: Moving averages can also act as support or resistance levels. If a price consistently bounces off a moving average, it could indicate that the moving average is acting as a support or resistance level. A breakdown below a support level or a breakout above a resistance level can signal a potential reversal.
Volume as a Confirmation Tool for Reversals
Volume, which measures the number of shares traded during a specific period, can also be a valuable indicator for confirming potential reversals in the market.
Here's how volume can be used:
Divergence between Price and Volume:
When the price makes a new high, but volume fails to reach a new high, it can indicate a potential bearish divergence. This suggests that sellers may be becoming less enthusiastic about the uptrend, potentially leading to a reversal.
Conversely,
When the price makes a new low, but volume fails to reach a new low, it can indicate a potential bullish divergence. This suggests that buyers may be becoming less enthusiastic about the downtrend, potentially leading to a reversal.
Volume Breakout:
A sharp increase in volume accompanying a breakout above a resistance level can be a strong signal of a bullish reversal. This indicates that a significant number of buyers have entered the market, potentially driving the price higher.
Conversely,
A sharp increase in volume accompanying a breakdown below a support level can be a strong signal of a bearish reversal. This indicates that a significant number of sellers have entered the market, potentially driving the price lower.
Conclusion
Reversal trading capitalize on changes in market trends. While there's no guaranteed way to predict reversals, understanding common indicators like chart patterns and technical analysis tools can significantly enhance your chances of success.
Remember Chart patterns like head and shoulders, triangles, and flags can signal potential reversals But use technical indicators like moving averages and volume to confirm these signals. Carefully consider entry and exit points, including breakouts, retests, and profit targets. Implement effective risk management strategies, such as stop-loss orders, to protect your capital.
Trade Smarter!