What is a trade setup and how can you build a winning one?

Many aspiring traders need help to identify the right opportunities and develop a winning strategy, But if this help is not there, it can lead to missed profits and frustrating losses.
But what if there was a way to simplify the process and build a strong foundation matching with your trading Style?
This blog post will equip you with the tools you need to create powerful trade setups, combining technical and fundamental Analysis for informed decisions. From pinpointing entry and exit points to managing risk effectively, we'll guide you through every step. So,
Let's discuss each thing in detail.
We start with the most basic question first,
What is a Trade Setup?
A trade setup refers to a set of criteria used to identify potential buying or selling opportunities. In simple terms, these are the conditions that need to be present for you to consider the trade. For Example, if you are a trader looking to trade a trend, a trend needs to be present in the first place.
A Trade setup is essentially a blueprint that helps traders decide when to enter or exit a trade.
How does Technical & Fundamental Analysis help in building a Trade Setup
Technical Analysis and fundamental Analysis play different but complementary roles in crafting a trade setup.
Technical Analysis Helps answer the question of "when" is an excellent time to enter or exit a trade based on technical cues.
Technical Analysis identifies potential entry and exit points for a trade based on historical price and volume data. We use tools like chart patterns, price action signals, and technical indicators to identify trends and potential reversals.
Fundamental Analysis helps answer the question: "Why" might the price move based on fundamental factors? It focuses on the underlying factors that affect a stock's or asset's intrinsic value. It analyzes company financials, news events, industry trends, and economic data.
A robust trade setup combines insights from both disciplines:
For Example, Let's say you identify a company with a solid track record, strong financials, and operating in a growing industry, meaning the Fundamentals look good.
Now, We move to Technical Analysis. Let's say the stock price is consolidating near a support level, and a bullish RSI divergence suggests a potential breakout.
This combination suggests a robust trade setup: you believe in the company's long-term prospects (fundamental Analysis), and the technical indicators hint at a possible price rise in the near future (technical Analysis).
Types of Trade Setups
As we have mentioned before, trade setups provide the entry and exit points for the trade. So, Broadly speaking, we can categorise trade setups in the following way;
1. Trade Setups based on Chart Patterns:
Specific chart patterns can indicate potential price movements. Recognizing these patterns can form the basis of a trade setup.
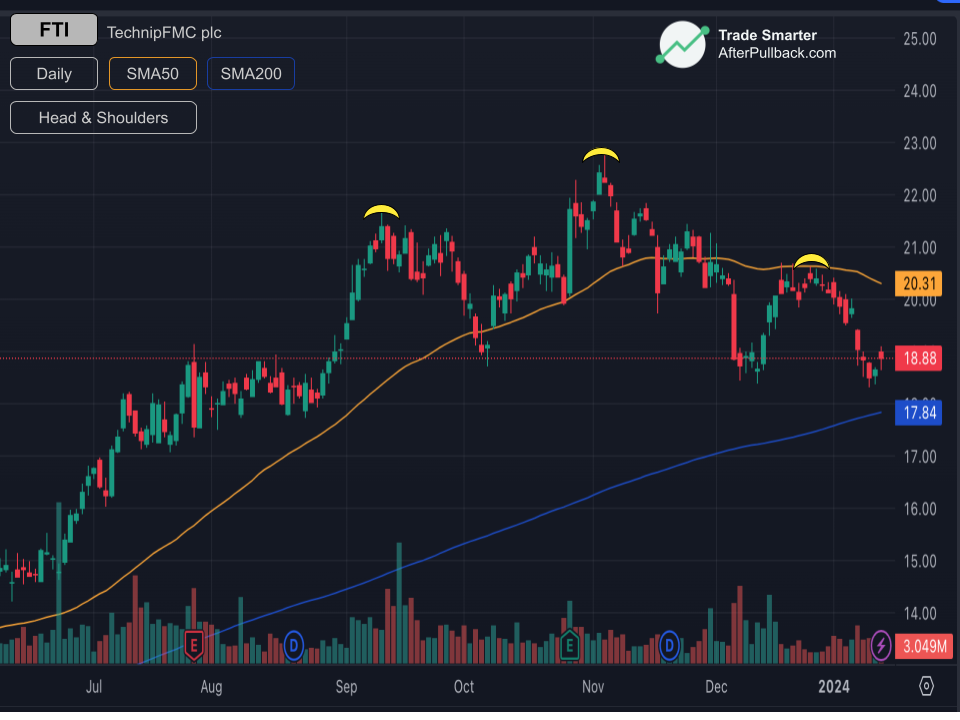
Patterns like Head & Shoulders resemble, well, a head with two shoulders, signifying a potential trend reversal from bullish to bearish. Look for a neckline break below the lows of the shoulders to confirm the reversal.
Similarly,
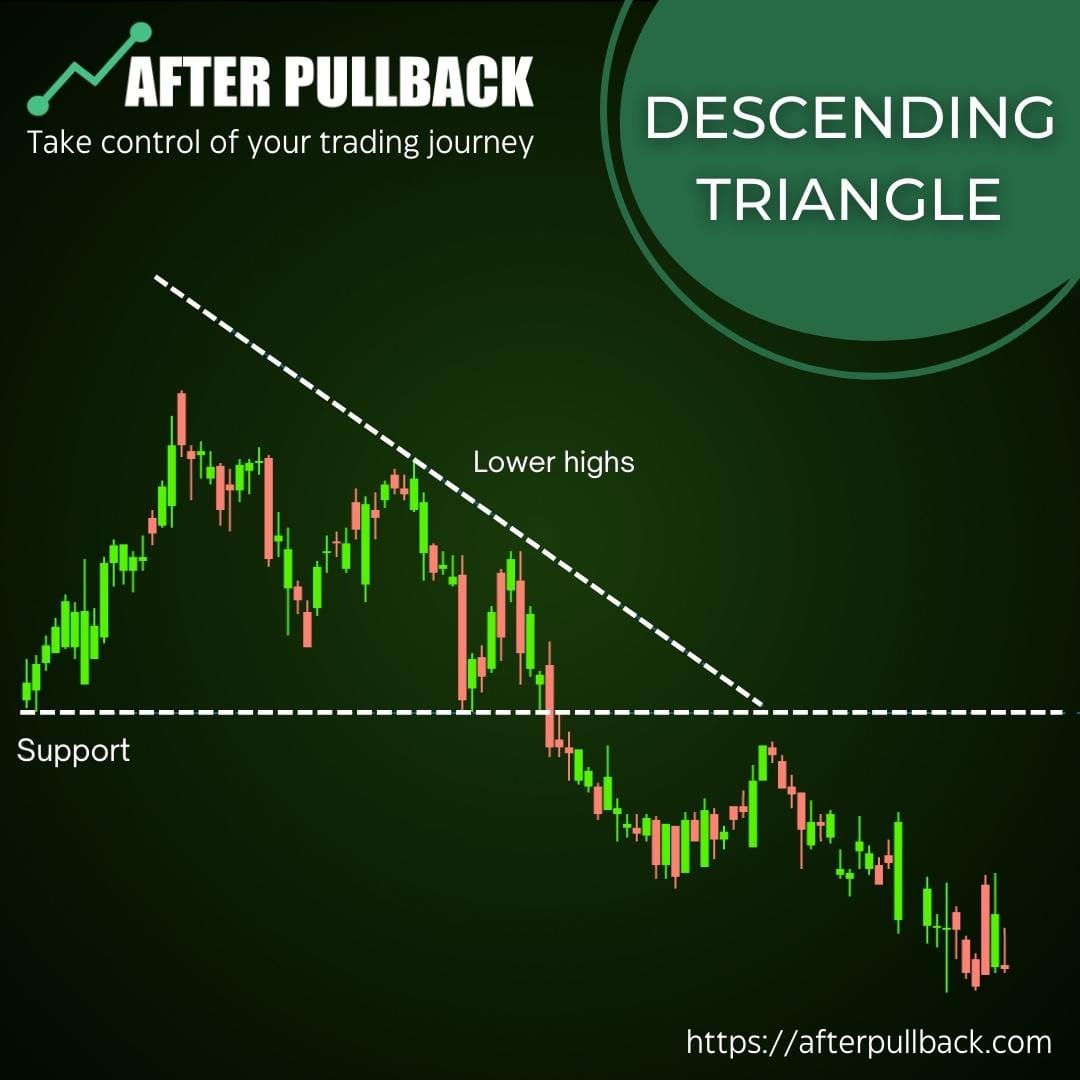
Ascending/Descending Triangles are also continuation patterns that form when the price gets squeezed between converging trendlines, typically in the direction of the prevailing trend. A breakout above Resistance in an ascending triangle or below support in a descending triangle suggests the trend will continue.
Also,

Consolidation patterns like Flags and Pennants appear during a trend. The price pauses within a channel with parallel trendlines before continuing the prevailing trend. A breakout above Resistance for flags or pennants following an uptrend signals continuation.
2. Trade Setups based on Price Action:
The Price action analysis focuses on how price interacts with support and resistance levels, breakouts, and pullbacks. These interactions can provide entry and exit signals.
For Example,
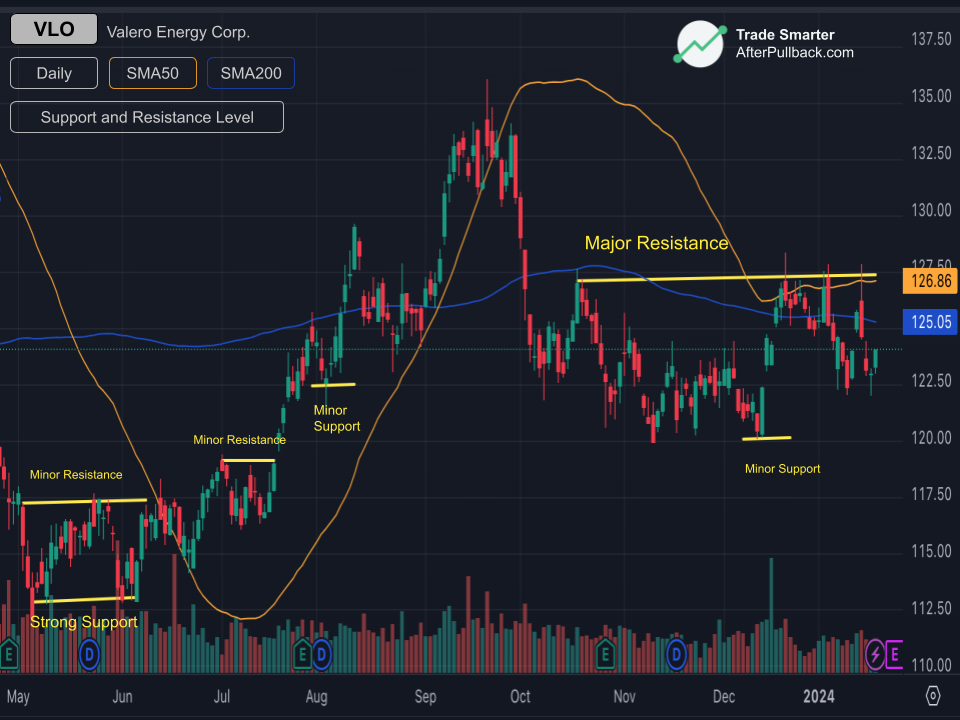
Support and Resistance can provide the traders with entry and exit points. Support is a price level where falling prices tend to find buyers, potentially causing a bounce. Conversely, Resistance is a price level where rising prices tend to meet sellers, potentially leading to a price drop. Breakouts above Resistance or below support can signal new trends.
Also
The breakouts occur when the price decisively moves above Resistance or below support. This can signify a new trend forming.
Entry and Exits can also be found through
There are also pullbacks. A pullback is a temporary decline in price following an uptrend. Pullbacks can be entry points for buying opportunities, especially if they find support at key levels.
3. Trade Setups based on Technical Indicators:
Technical indicators are mathematical calculations plotted on a price chart to gauge momentum, overbought/oversold conditions, and potential future price movements. They can be used to complement price action and chart patterns, helping to confirm entry and exit signals:
Indicators like the Relative Strength Index (RSI) measure the momentum of price movements and indicate potential overbought (above 70) or oversold (below 30) conditions. A reversal in the RSI's direction can hint at a possible trend change.
Similarly, Moving Average Convergence Divergence (MACD) uses two moving averages to identify trend direction, momentum, and potential reversal points. A bullish MACD crossover (when the MACD line crosses above the signal line) can signal a buying opportunity, while a bearish crossover suggests a potential sell signal.
& also the Bollinger Bands.
Bollinger Bands consist of a moving average with two bands above and below. The bands widen and contract based on volatility. Price movements near the Bollinger Bands can indicate potential overbought or oversold conditions, while breakouts above the upper band or below the lower band can suggest strong trends.
How to Build Your Trade Setups:
Alright,
So now you know that refining your trading strategy hinges on building strong trade setups, and we have discussed some High Impact trading Setups before as well,
But How do you build one?
Well, Building a Strong Trade Setup involves a series of steps to identify potential entry and exit points, manage risk, and validate your approach.
Here's a breakdown of the key components:
Step 1: Define your Entry points:
This is the core of your trade setup, where you decide when to enter a trade.
As we have discussed before, you can use Price Action, looking for specific price movements that suggest a potential trend change or continuation. This could be a breakout, pullback, or a recognized chart pattern like a head-and-shoulders. Even Gap ups and Gap Downs in price can be potential entry points.
Technical Indicators can complement price action signals or provide additional insights. For instance, an RSI hovering near 30 (oversold) might indicate a potential buying opportunity after a price pullback, while a bullish MACD crossover (when the MACD line crosses above the signal line) could support a long entry during an uptrend.
Pro Tip: Don't rely solely on one indicator or price action signal. Look for confluence, where multiple factors point towards the same direction (e.g., breakout above Resistance confirmed by an RSI moving above 30). This strengthens the entry trigger.
Step2: Set Exit Points and Profit Targets
Alright, So setting the exit points is an exciting part because here you are eyeing two kinds of targets,
One—If this becomes a profitable trade, then how much Profit are you willing to take in and exit?
&
Number 2- If the trade results in a loss, how much loss you are prepared to bear?
Let's discuss first Profit Taking.
Setting a Profit target determines how much you aim to gain from the trade. For Example, for a Fixed Price Target, you can set a specific price level to exit the trade and lock in profits. This might be based on technical Analysis, like the price reaching the top of a rising channel.
Profit Targets can also be based on Percentage Gain, where you decide on a desired percentage gain from your entry price. This allows you to adjust the exit point based on market movements.
Another way to lock profit targets is to use Trailing Indicators. These indicators, like moving averages, can be used to dynamically adjust your profit target as the trade progresses in your favour. For Example, a trailing stop-loss based on a 20-period moving average would automatically raise your exit point as the price moves up.
Ok,
So Once the Profit Target has been determined, you also need to set the
The Stop-Loss Placement
This is a critical risk management tool. A stop-loss order automatically exits your trade if the price reaches a certain level, limiting your potential losses.
There can be many types of stop loss. Some are a bit advanced, like AON or Bar by Bar Stop Loss, and some are fairly straightforward, like Stop Losses based on Pivot Points and Moving Average (our personal favourite is Stop Loss based on ATR).
Coming back to the topic, It is important to place the Stop Loss Orders to exit the trades. For Example, For Long Trades, You can place your stop-loss just below support (e.g., below the previous swing low or below a moving average acting as support).
Conversely, For Short Trades, You can Place your stop-loss just above Resistance (e.g., above the previous swing high or a moving average acting as Resistance).
Step 3: Set your Risk Parameters
Risk Management is an important step in your trade setup. In fact, it's all about managing your capital effectively to avoid excessive risk in any single trade. For this,
It would help if you used Position Sizing, which is the amount of money you allocate to a trade. A common approach is to risk only 1-2% of your total trading capital per trade. This helps spread your risk and allows you to stay invested even if you experience some losing trades. Here's the formula:
Position Size (%) = (Risk Percentage) x (Total Account Value) / (Entry Price)
For Example, if you have a $10,000 account, are willing to risk 1% per trade, and the entry price is $20 per share, your position size would be:
Position Size (%) = (1%) x ($10,000) / ($20) = 50 shares
Similarly, You should Consider the Risk-Reward Ratio.
This compares your potential profit to your potential loss. Aim for setups with a higher reward-to-risk ratio (e.g., 2:1 or 3:1). This means you stand to gain more than you risk on a successful trade.
Here's how to calculate it:
Risk-Reward Ratio = (Profit Target - Entry Price) / (Stop-Loss Price - Entry Price)
For instance, if you enter a long trade at $20, set a profit target at $25, and a stop-loss at $18, your risk-reward ratio would be:
Risk-Reward Ratio = ($25 - $20) / ($18 - $20) = 5:2
By considering both position sizing and risk-reward ratio, you can ensure you're not risking too much on any single trade while aiming for setups with the potential for more significant profits.
Step 4: Backtest the Setup:
Before risking real money, always Backtest your trading strategy and setups using historical data.
The First Step in doing backtesting is to Choose a Backtesting Period. You should select a historical timeframe that reflects current market conditions. Ideally, choose a period that's at least a few years long to capture different market environments (uptrends, downtrends, periods of consolidation).
Once you have chosen the time period, Apply Your Setup. Simulate trades based on your entry and exit criteria on the historical data. Many trading platforms and online tools offer backtesting functionalities like AfterPullback. You can also create a spreadsheet to track your simulated trades manually.
Once you have applied your setup, it's time to Evaluate Performance. Analyze the results of your backtested trades to assess the effectiveness of your setup. You can use metrics like Win Rate, the percentage of trades that were profitable. Aim for a win rate that's higher than your risk-reward ratio (e.g., if your risk-reward ratio is 2:1, you can aim for a win rate above 50%).
There are other metrics as well, like Average Win/Loss Size, which indicates how much you typically gain on winning trades compared to how much you lose on losing trades.
Similarly, The Profit Factor compares your average winning trade size to your average losing trade size. A profit factor greater than 1 indicates that your winning trades are, on average, more significant than your losing trades.
Whatever Metric you choose, the key is that backtesting can identify potential weaknesses in your setup. For instance, if your win rate is low, you should refine your entry triggers or adjust your stop-loss placement. If your average loss size is significantly larger than your average win size, you should reconsider your risk-reward ratio or position sizing.
In Conclusion,
Building winning trade setups requires a combination of technical and fundamental Analysis, along with well-defined entry and exit points, proper risk management strategies, and backtesting. By following these steps and continuously refining your approach, you can increase your chances of success in the markets.
Trade Smarter!


