What are the Best Indicators for Swing Trading?

Imagine surfing a wave - you wait for the right opportunity (the trend), catch the wave (enter a position), ride it for a while (hold the position), and then jump off at the peak (exit the position with a profit) before the wave crashes.
This is Swing trading, a style of trading where you hold positions for days or weeks, aiming to profit from short-term swings in an asset's price.
For those who prefer to capitalize on trends within a strong uptrend or downtrend, check out our blog on 'How to do Swing Trading using Trend Trading Strategy'. However, markets don't always move in a straight line, so if you're interested in capturing opportunities in range-bound markets, be sure to read 'How to Make a Trade Setup for Range-Bound Markets
But how do you identify these Price Movements?
The answer is , with the help of Technical Indicators by learning Technical Analysis.
In the blog post below, We will discuss these technical indicators to see how they can help us identify swing trading opportunities.
So, Let's Go.
Best Indicators for Swing Trading
In swing trading, technical indicators play a crucial role in formulating strategies and identifying entry and exit points. These Indicators help you in;
· Visualizing Trends
· Gauging Momentum
· Identifying Overbought/Oversold Conditions &
· Setting Support and Resistance Levels:
So, we divide the Technical Indicators for Swing Trading into the following;
1) Trend Indicators:
Moving Averages (MAs) are a cornerstone technical indicator used by swing traders to identify trends. They act as a trend filter, smoothing out short-term price fluctuations and revealing the underlying price direction.
One of the most common moving averages is
Simple Moving Average (SMA)
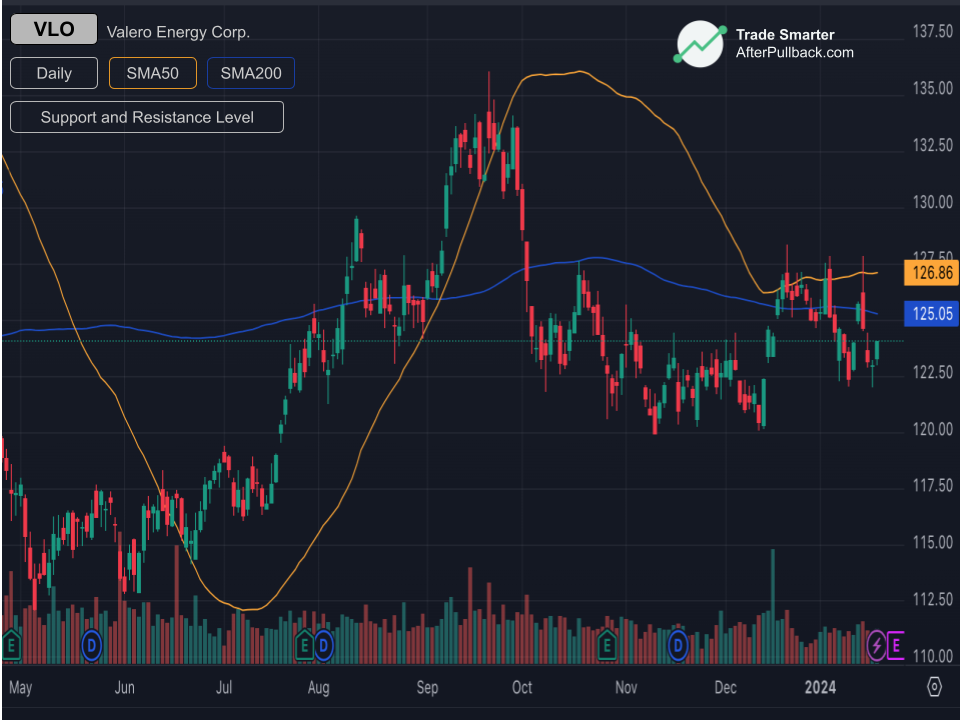
The SMA is the most basic type of moving average. It's calculated by simply averaging the closing prices of an asset over a chosen period (e.g., 50 days, 200 days).
So,
If an SMA is rising, It indicates an uptrend, while a falling SMA suggests a downtrend.
And if a Price is consistently trading above a long-term SMA (e.g., 200-day), It is a strong sign of an uptrend, and vice versa for a downtrend.
But the problem with SMA is , that they may not capture sharp turns in the trend quickly.
So, We use
Exponential Moving Average (EMA):
The EMA assigns more weight to recent prices, making it more responsive to current market movements compared to the SMA. This can be beneficial for swing traders who want to react to recent price action.
Similar to the SMA, a rising EMA suggests an uptrend, and a falling EMA indicates a downtrend.
And,
Due to the emphasis on recent prices, the EMA reacts quicker to trend changes than the SMA. This can be helpful for identifying potential trend reversals earlier.
But it’s a Trade-off
The increased responsiveness of the EMA can also lead to more false signals, especially in choppy markets.
Then, the question arise,
How to Choose Between SMA and EMA for Trend Identification?
See, Most of the experienced traders
Focus on Long-Term Trend
If you prioritize confirmation of a well-established trend, the SMA might be a better choice due to its smoother nature,
But
If you want to identify potential trend changes sooner, the EMA's responsiveness might be more valuable.
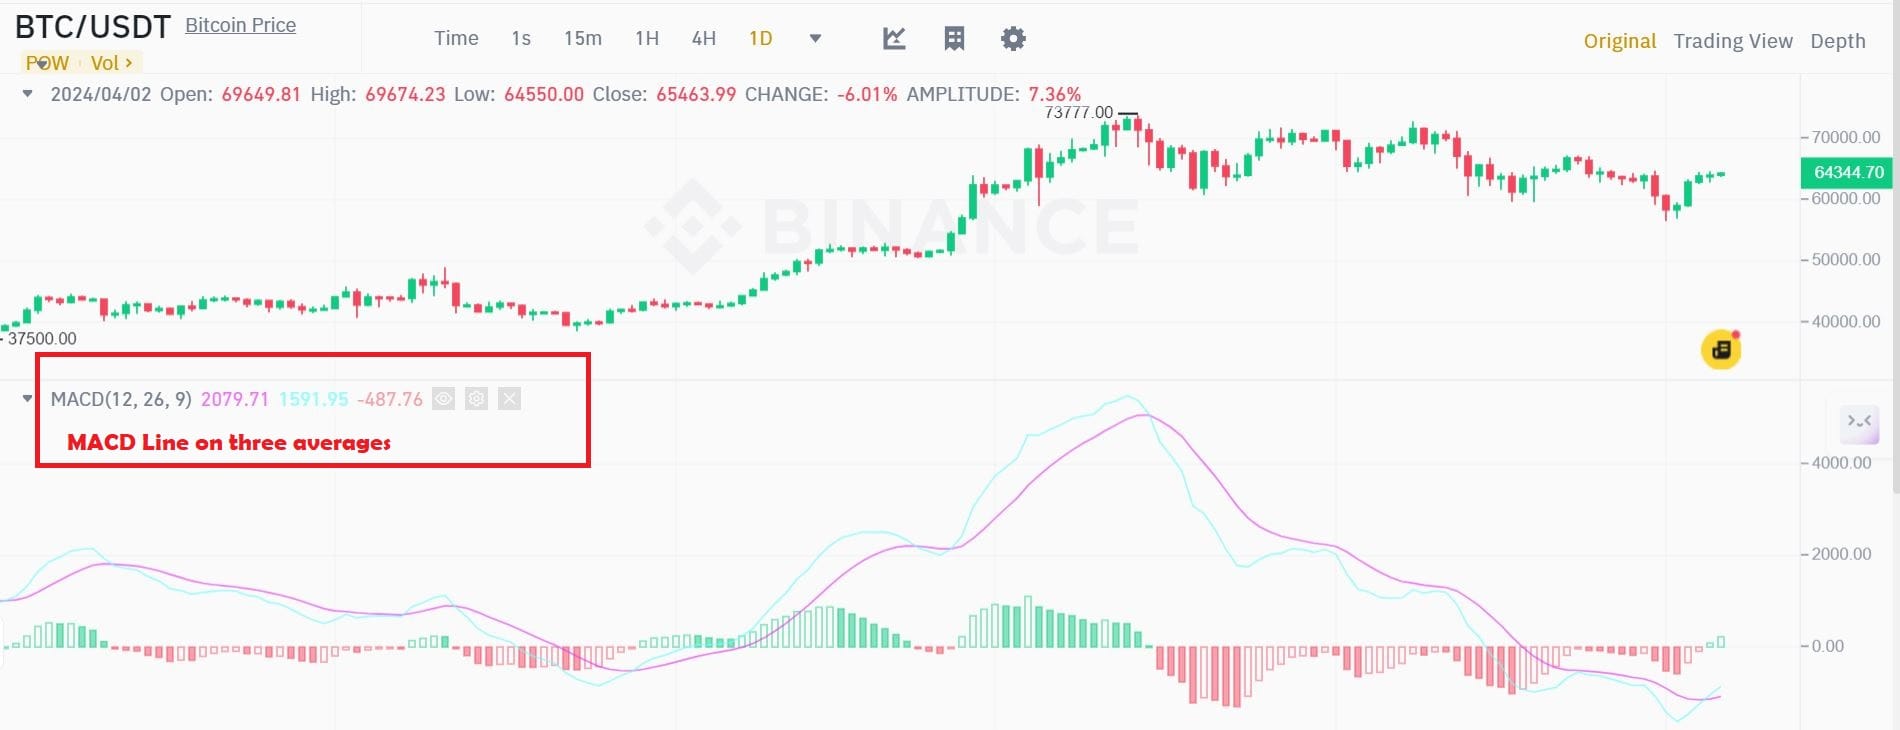
The Moving Average Convergence Divergence (MACD) deserves a brief mention here as it builds upon concepts from Moving Averages (MAs). It's a combined trend-following and momentum indicator that utilizes aspects of both SMAs and EMAs. By analyzing the relationship between two moving averages and a signal line, the MACD helps swing traders gauge trend strength and potential turning points. We'll explore the specifics of MACD interpretation in a dedicated section later.
2) Momentum Indicators
The Relative Strength Index (RSI)
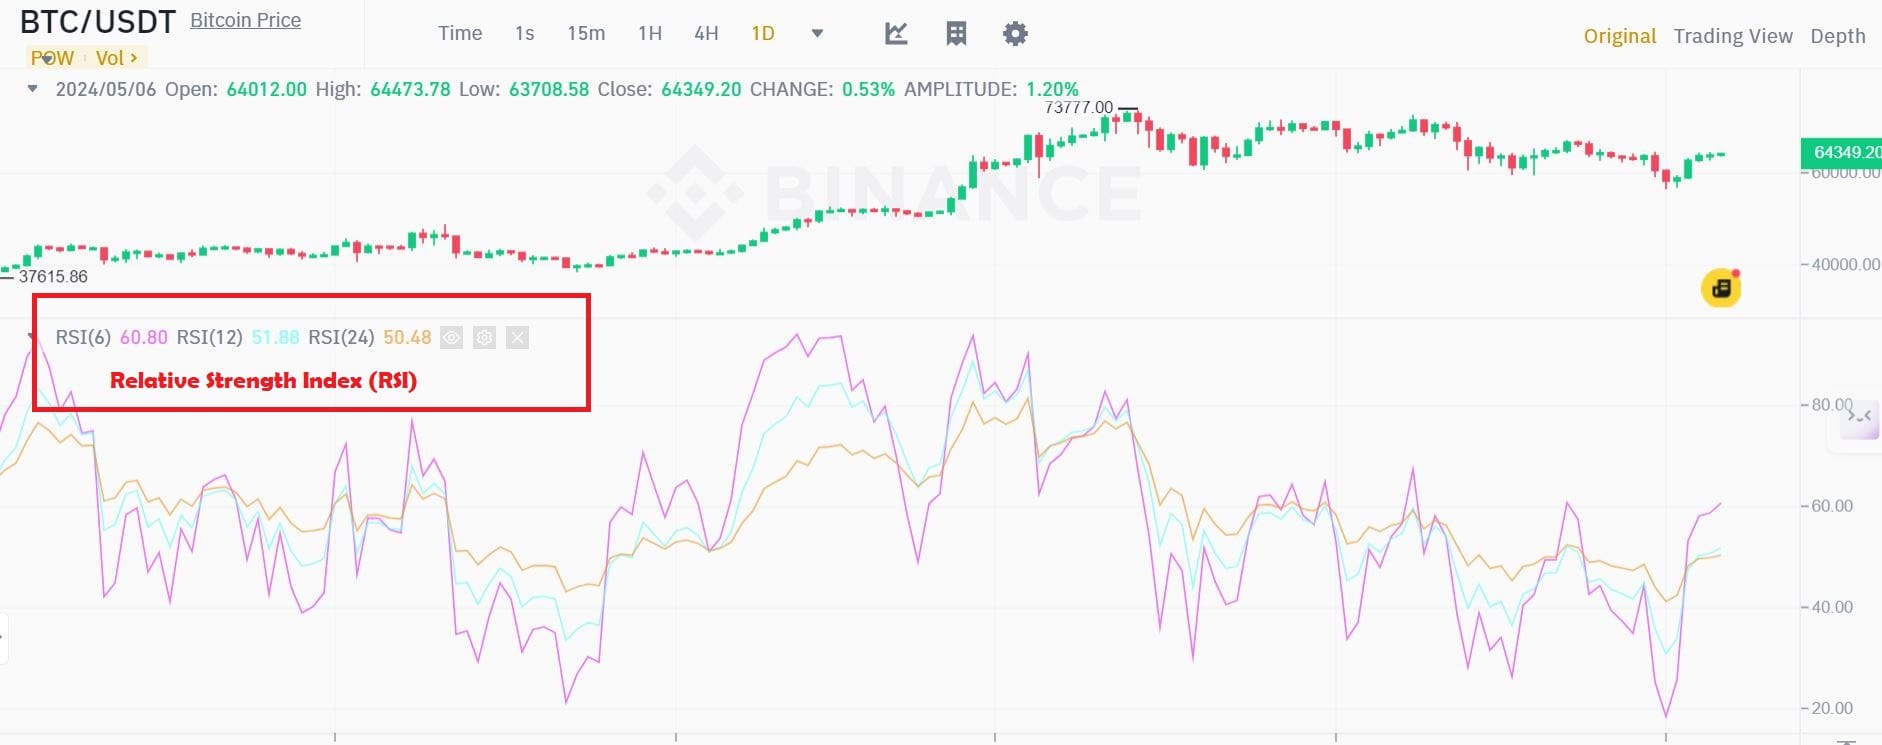
RSI is a popular momentum oscillator used by swing traders to assess whether an asset is overbought (priced too high) or oversold (priced too low) in relation to its recent price history.
The RSI is a value between 0 and 100, calculated based on the average of a security's recent price gains compared to its average losses.
Traditionally, an RSI reading above 70 is considered overbought, suggesting the asset might be due for a price correction. Conversely, an RSI reading below 30 indicates an oversold condition, potentially signaling a buying opportunity.
How to use RSI for Swing Trading?
Swing traders use RSI to identify these overbought and oversold zones to potentially enter or exit positions. For example, a swing trader might sell an asset when the RSI reaches overbought territory, anticipating a price decline. Conversely, they might consider buying when the RSI dips into oversold territory, expecting a price rebound.
But RSI has some Limitations
RSI is a relative indicator, and the overbought/oversold thresholds can vary depending on the asset and market conditions. Additionally, the RSI doesn't predict the timing or extent of a price correction. It simply suggests a higher likelihood based on historical data.
The Stochastic Oscillator
is another valuable tool for spotting momentum shifts and potential trend reversals.
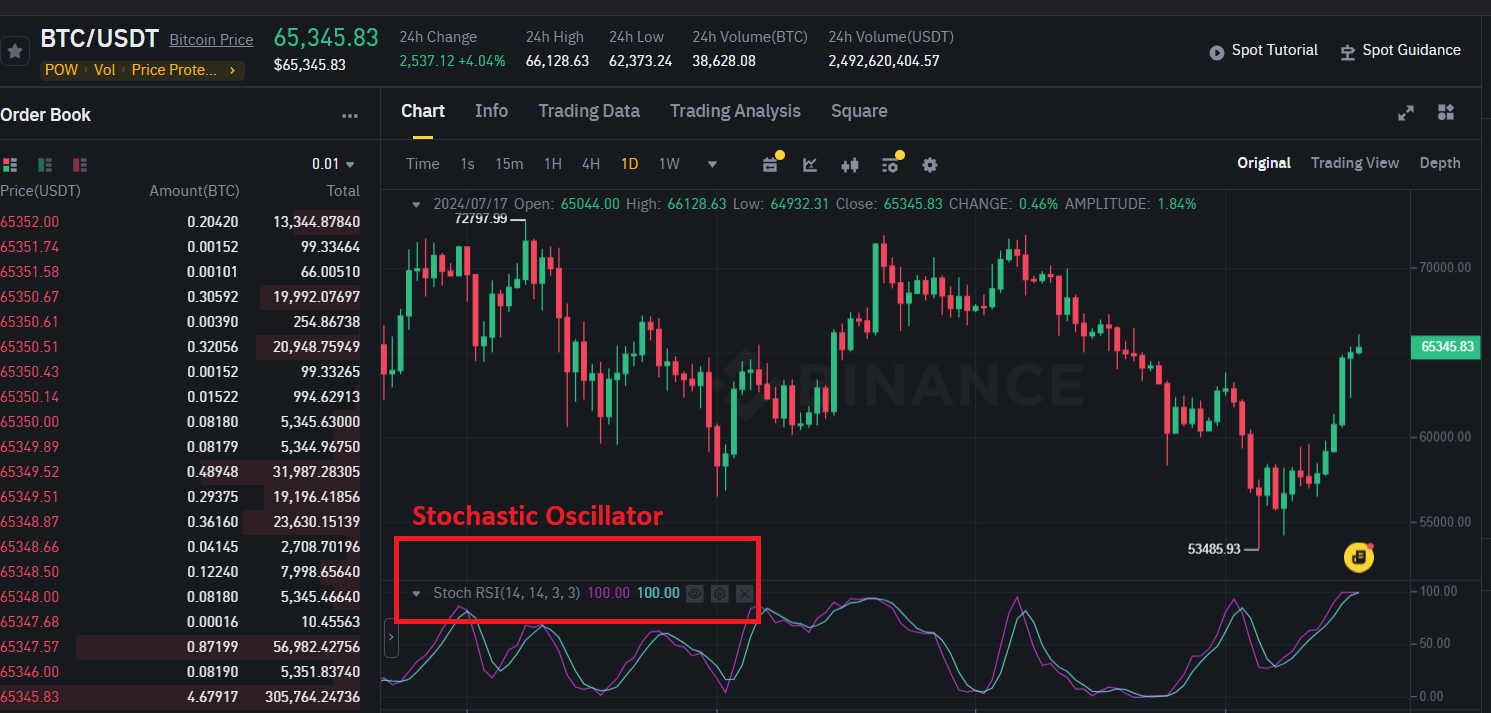
Unlike the RSI, which focuses on recent price gains and losses, the Stochastic Oscillator compares the current closing price of an asset to its price range over a specific period (often 14 days).
It's displayed as two lines (%K and %D) oscillating between 0 and 100. The %K line represents the most recent closing price relative to the price range. The %D line is a moving average of %K, smoothing out fluctuations.
Similar to the RSI, the Stochastic Oscillator has overbought and oversold zones, typically defined as above 80 and below 20, respectively.
How Stochastic Oscillator works for Swing Traders?
Swing traders use these zones to identify potential turning points in the trend. A reading above 80 suggests momentum might be waning, potentially leading to a price decline. Conversely, a reading below 20 indicates weak selling pressure, hinting at a possible price rebound.
Stochastic Oscillator can give some Additional Insights as well.
Beyond the overbought/oversold zones, the direction of the %K and %D lines can also provide clues. If they're diverging from the price movement (e.g., price keeps rising but the lines are falling), it might signal a weakening trend and potential reversal.
The Ease of Movement (EOM)
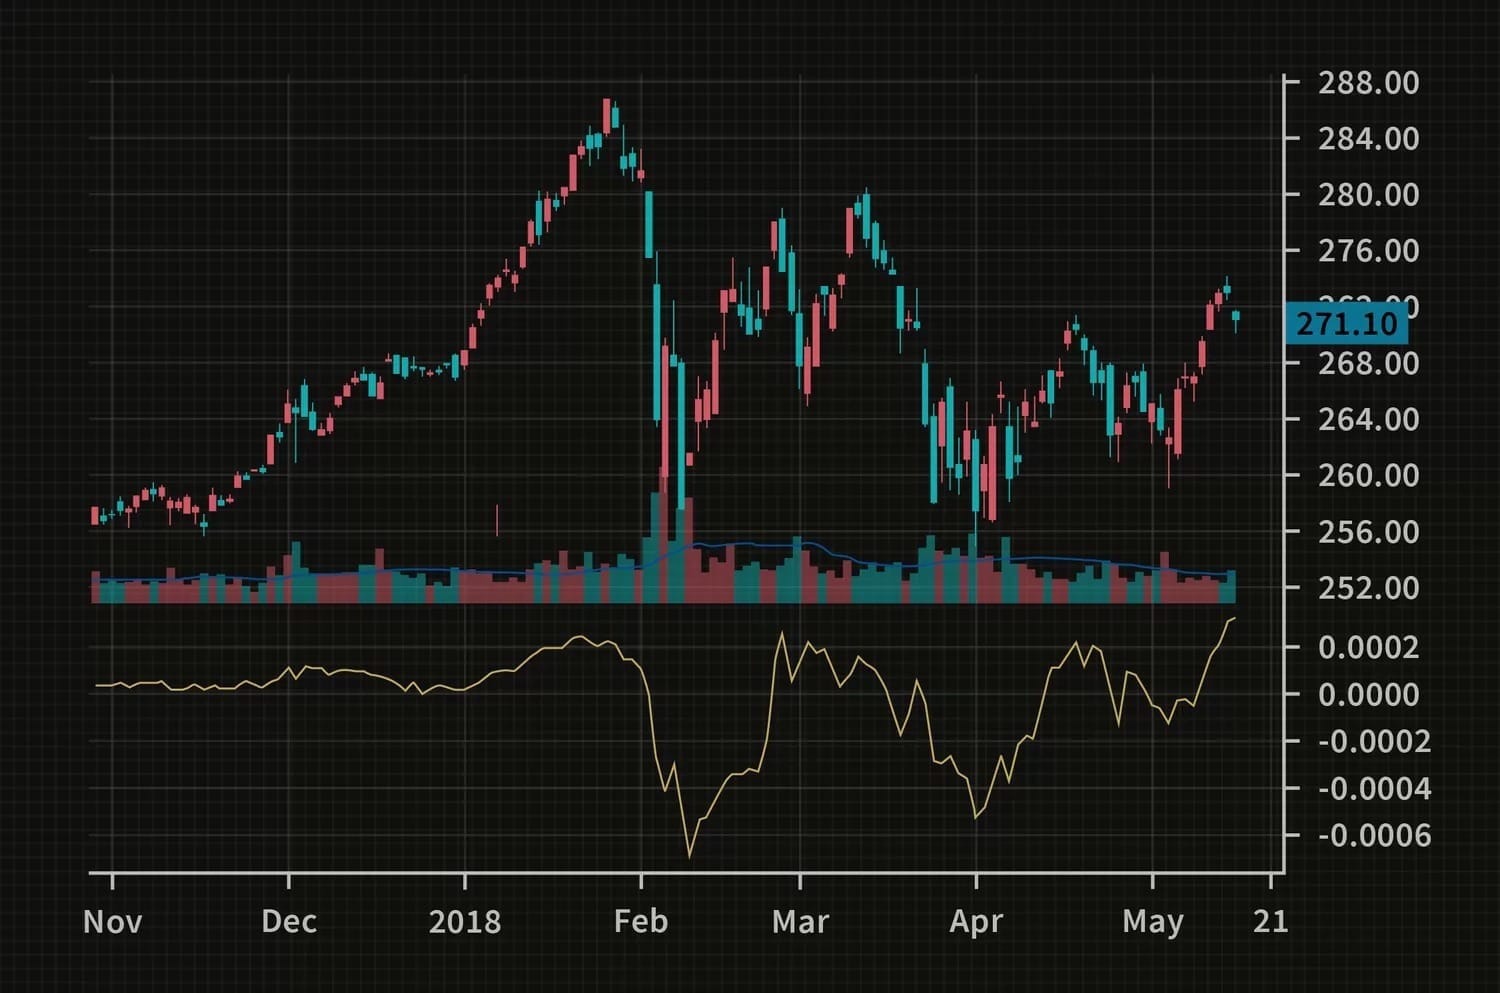
also sometimes referred to as Ease of Movement Value (EMV), is another technical indicator that can be helpful for swing traders. It provides insights into the underlying strength behind a price movement, rather than solely focusing on overbought/oversold conditions.
EOM considers both price changes and trading volume to determine how easily the price is moving in a particular direction.
A rising EOM suggests prices are advancing with relative ease, potentially indicating a strong uptrend. Conversely, a falling EOM suggests prices are declining with ease, possibly signaling a strengthening downtrend.
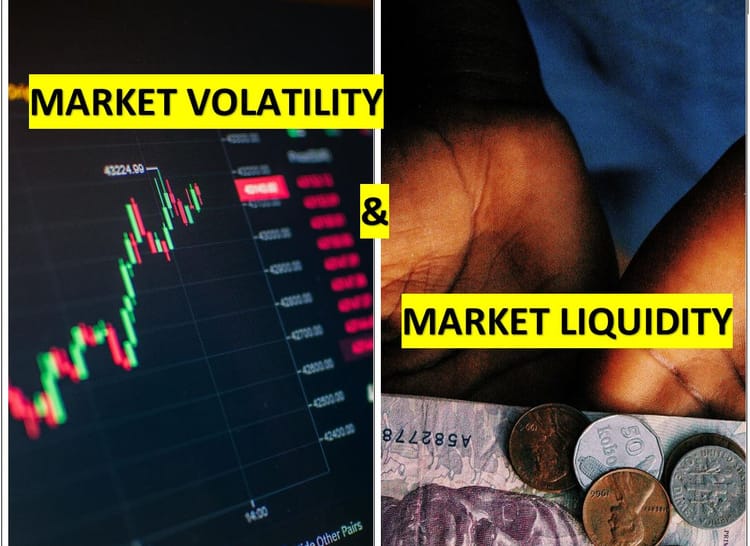
3) Volatility Indicators:
Price action scanners are a great tool to navigate volatility in the market and even use it to your advantage using the following indicators
Bollinger Bands
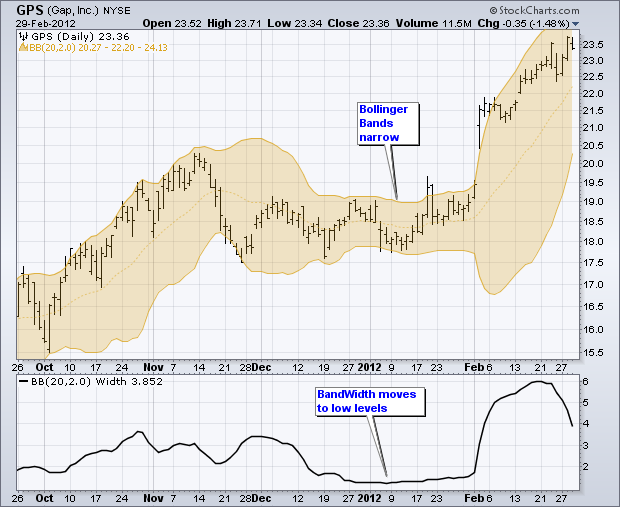
Bollinger Bands are a versatile technical indicator widely used by swing traders to gauge market volatility and identify potential price breakouts.
Bollinger Bands consist of three lines:
· A middle band, typically a 20-day moving average, representing the average price over that period.
· An upper band, placed a certain number of standard deviations (usually two) above the moving average.
· A lower band, placed the same number of standard deviations below the moving average.
The distance between the upper and lower bands reflects the market's volatility. Wider bands indicate higher volatility, suggesting larger price swings. Conversely, narrower bands suggest lower volatility and potentially a more range-bound market.
How Bollinger Bands help swing traders?
As shown in picture above, Bollinger Bands help Identifying Breakouts. Price movements outside the Bollinger Bands can signal potential breakouts.
A price surge that breaks above the upper band might indicate a strong uptrend or a potential overbought condition. Swing traders might use this to enter long positions (buying) or exit existing short positions (selling) based on their strategy.
Conversely,
a price plunge that breaks below the lower band could suggest a downtrend or an oversold condition. This might prompt swing traders to enter short positions (selling) or exit existing long positions (buying).
This is one of the ways swing trading works in Volatile Market. To learn about more such ways, you can have a look at our blog How to do Swing Trading in Volatile Markets
On-Balance Volume (OBV)
deserves a mention as a tool to assess buying and selling pressure.
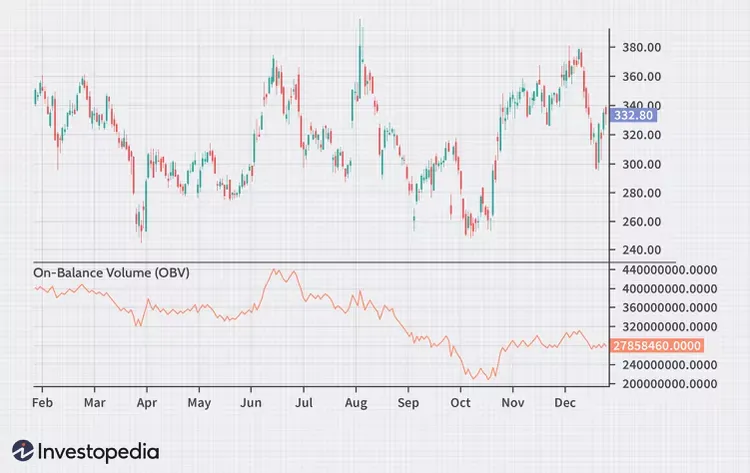
OBV is a cumulative indicator that tracks volume changes based on price movements. It essentially adds volume to a running total when the price closes higher and subtracts volume when the price closes lower.
A rising OBV suggests increasing buying pressure, potentially indicating an uptrend. Conversely,
a falling OBV suggests selling pressure might be on the rise, hinting at a possible downtrend.
While the absolute value of OBV isn't as important, the direction of its movement over time is more insightful for swing traders. It helps gauge the underlying buying or selling sentiment behind a price move.
4) Price Action Indicators:
Although Price action scanners can suggest a multitude of indicators, the most commonly used remains the
Support and resistance levels
hold immense significance for identifying potential reversal points within a trend.
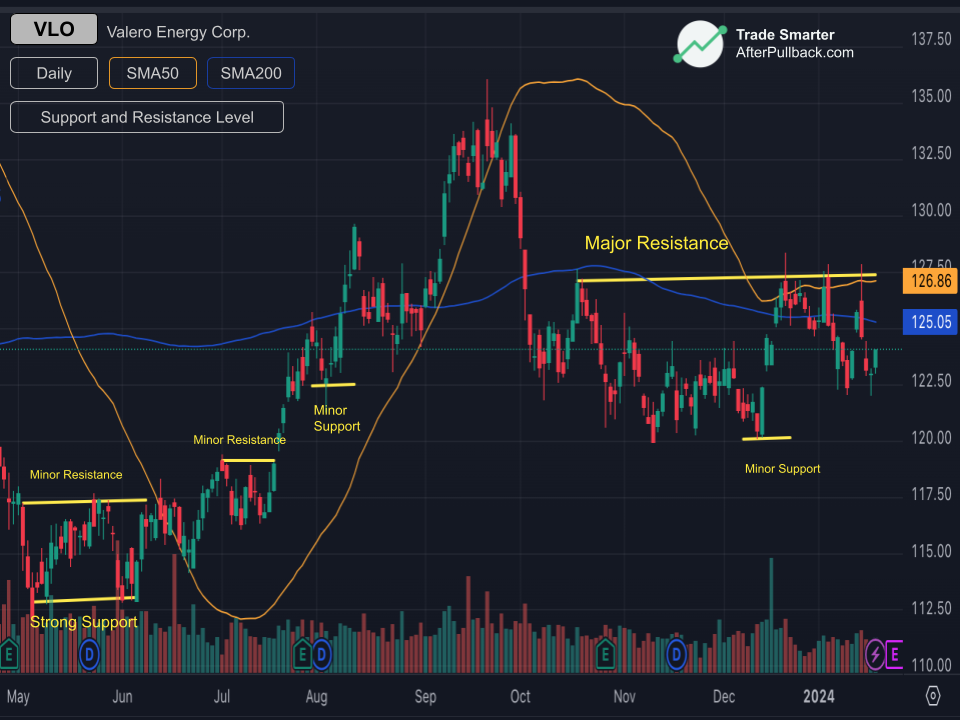
Support represents a price level where buying pressure historically becomes strong enough to prevent the price from falling further. Conversely, resistance represents a price level where selling pressure historically becomes strong enough to impede the price from rising further.
How do Support and resistance levels help swing traders?
You see,
By analyzing historical price charts and past interactions with these levels, swing traders can anticipate potential areas where the trend might reverse.
· A price bouncing off support after a decline suggests buying interest might be overcoming selling pressure, hinting at a potential trend reversal upwards.
· Conversely, a price rejection at resistance after an incline suggests selling pressure might be overpowering buying interest, indicating a possible trend reversal downwards.
These reversal points around support and resistance zones can be used as potential entry and exit points for swing trades.
A swing trader might enter a long position (buying) near support, anticipating a price bounce and uptrend continuation.
Conversely,
they might exit a long position (selling) or even enter a short position (selling borrowed shares) near resistance, anticipating a price rejection and downtrend.
Fibonacci Retracements
are another tool swing traders can utilize to predict areas where price might retrace after a strong move.
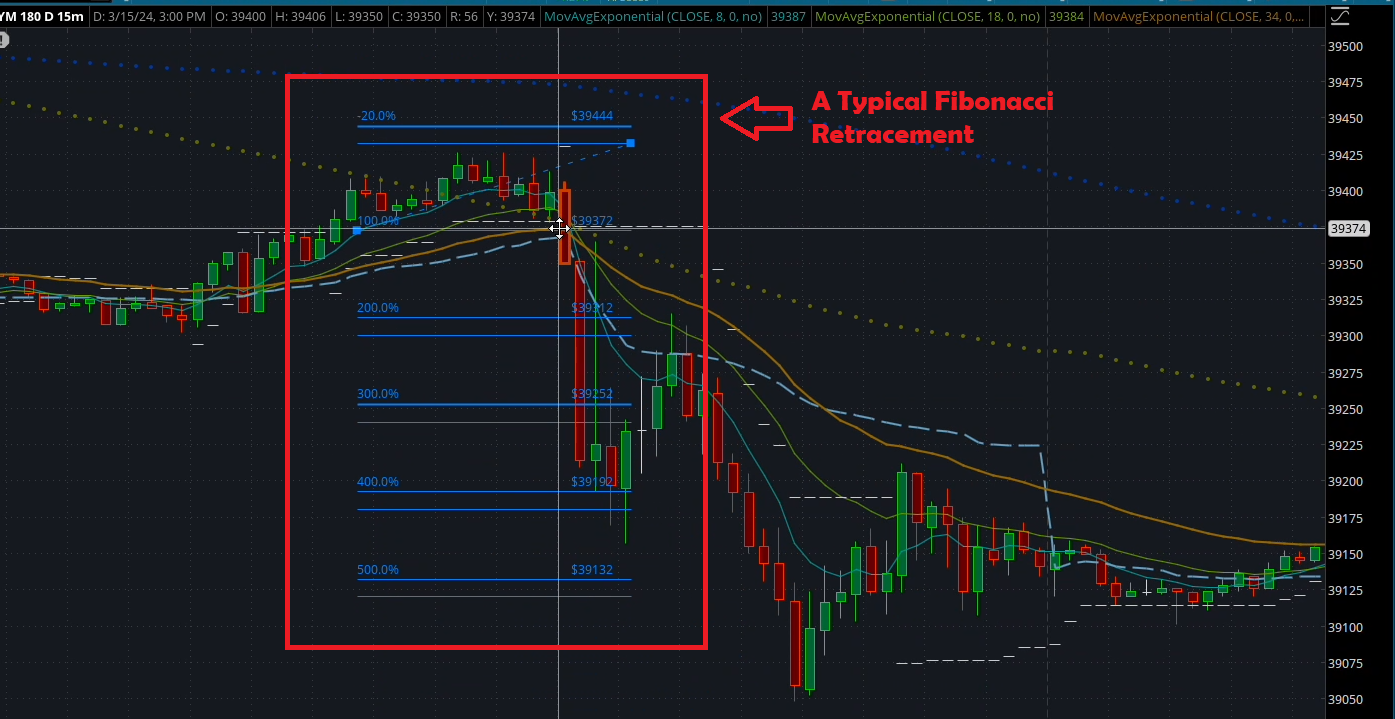
Fibonacci Sequence leverages ratios derived from the Fibonacci sequence, a mathematical series where each number is the sum of the two preceding ones (0, 1, 1, 2, 3, 5, etc.).
Common retracement levels used are 23.6%, 38.2%, 50%, and 61.8%. These percentages are applied to the vertical distance of a strong price move (up or down) to identify potential retracement zones.
This gives you
Areas of Support/Resistance
The theory suggests that these Fibonacci ratios act as psychological levels where traders might place orders, potentially creating temporary support or resistance during a price retracement.
But they also have Limitations
Fibonacci Retracements are not exact predictions and shouldn't be used in isolation. Price may not retrace to these specific levels, and other factors can influence its movement.
Conclusion
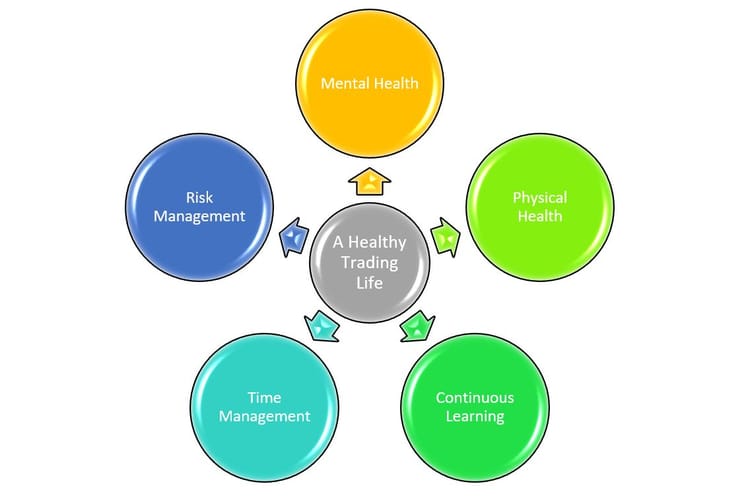
Success in swing trading requires continuous learning and adaptation. Stay updated on market trends, refine your strategies based on experience, and never stop honing your skills. By using indicators effectively and practicing sound risk management, you can increase your chances of navigating the ever-changing market landscape and achieving sustainable trading success.
Trade Smarter!