What Are Inside Bars and How the Intraday Scanner Can Help Recognize them
We all know that the Market is a tug-of-war between bulls (buyers) and bears (sellers). A strong trend signifies one side has the upper hand, driving the price up (uptrend) or down (downtrend).
But Don’t you wonder,
There must be some times when either party doesn’t have an upper hand?
We tell you,
Yes, There are
These are the times when the candlestick patterns in your charts show
Inside Bars!
So,
What are Inside Bars?
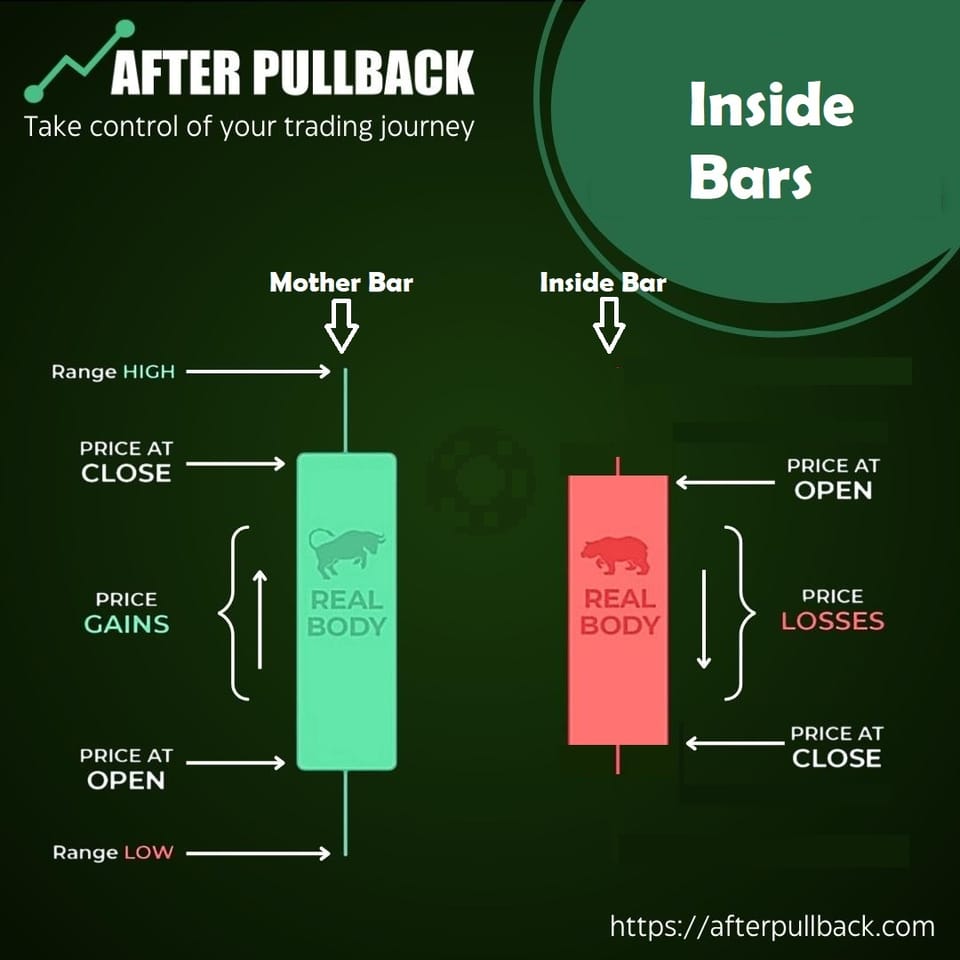
Inside bars are a two- candlestick pattern used in technical analysis of financial markets, specifically to identify periods of consolidation or indecision in price movements.
In Inside bars, The second candlestick (inside bar) is entirely contained within the price range of the first candlestick (mother bar).
This means the high of the inside bar is lower than the high of the mother bar, and the low of the inside bar is higher than the low of the mother bar.
Why this happens?
Because, The bulls might push the price higher than the previous day's high (mother bar), but the bears fight back, preventing it from going significantly higher.
Similarly,
On a downtrend, the bears might push the price lower than the previous day, but the bulls step in, keeping it from dropping much further.
This creates the inside bar pattern, where the price action of the second candlestick (inside bar) is confined within the range of the first candlestick (mother bar). It visually represents this period of indecision or consolidation.
Trading Opportunities With Inside Bars
The point here to note is,
That an inside bar doesn't tell you definitively which way the price will break. It simply indicates a temporary pause where the direction is uncertain.
However, One thing becomes certain from this indecision of the market
That the price will either move down or move up from this point!
If the price decisively breaks above the high of the mother bar, it suggests the bulls might be regaining control, potentially signaling a continuation of the uptrend or a new uptrend if the prior trend was flat or slightly down.
Conversely,
If the price decisively breaks below the low of the mother bar, it suggests the bears might be taking charge, potentially indicating a continuation of the downtrend or a new downtrend if the prior trend was flat or slightly up.
 Imran Haider
Trading Strategies with Inside Bars
Inside bars offer potential trading opportunities in both trending and ranging markets. Here are some of those Trading Strategies:
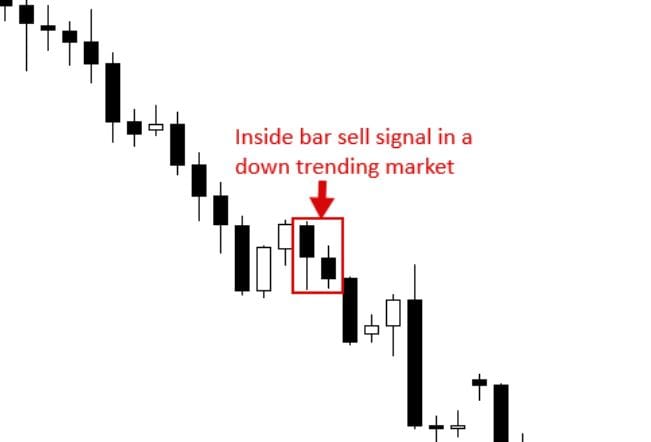
1. Breakout Plays (Trending Markets):
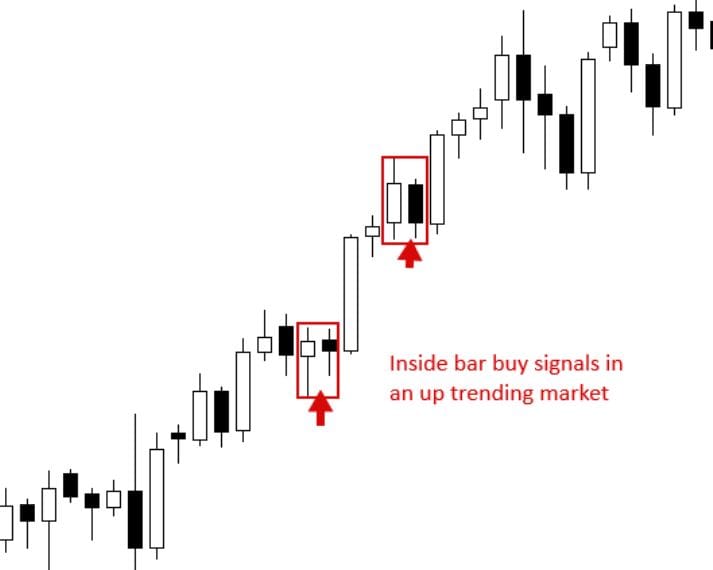
When an inside bar forms within an established uptrend (higher highs and higher lows) or downtrend (lower highs and lower lows), a breakout above/below the mother bar can signal a continuation of the trend.
This gives you an opportunity for
Breakout Entry
The classic entry for a breakout play involves placing a:
Buy stop order above the high of the mother bar in an uptrend.
Sell stop order below the low of the mother bar in a downtrend.
These orders are triggered only if the price decisively breaks above/below those levels, suggesting the trend might resume.
But you have to take some additional
Confirmation
While breakouts provide potential entry points, experienced traders often seek confirmation before committing.
This might involve Confirmation through Volume. A surge in volume on the breakout signifies stronger buying/selling pressure and potentially a more sustained move.
Technical Indicators can also be employed. RSI moving out of oversold/overbought territory or MACD crossover for confirmation of the trend's direction.
2. Reversal Signals (Key Chart Levels):
Inside bars can also hint at potential trend reversals, especially when they form near significant support (for uptrend reversals) or resistance levels (for downtrend reversals).
Reversal Entry: If an inside bar appears near support/resistance, and the price breaks opposite the prevailing trend direction:
For the Long entry, You can consider a buy-stop order slightly above the inside bar's high for a potential reversal in a downtrend.
Similarly,
For the Short entry, You can consider a sell stop order slightly below the inside bar's low for a potential reversal in an uptrend.
But
Exercise Caution!
Because,
Reversals are inherently less certain than breakouts. False breakouts can occur, so proper risk management is crucial. Look for additional signs of weakness in the trend before entering a reversal trade.
3) Continuation pattern with Inside Bars
If you need some more confirmation of the Over and above the Inside bars,
Here is something more!
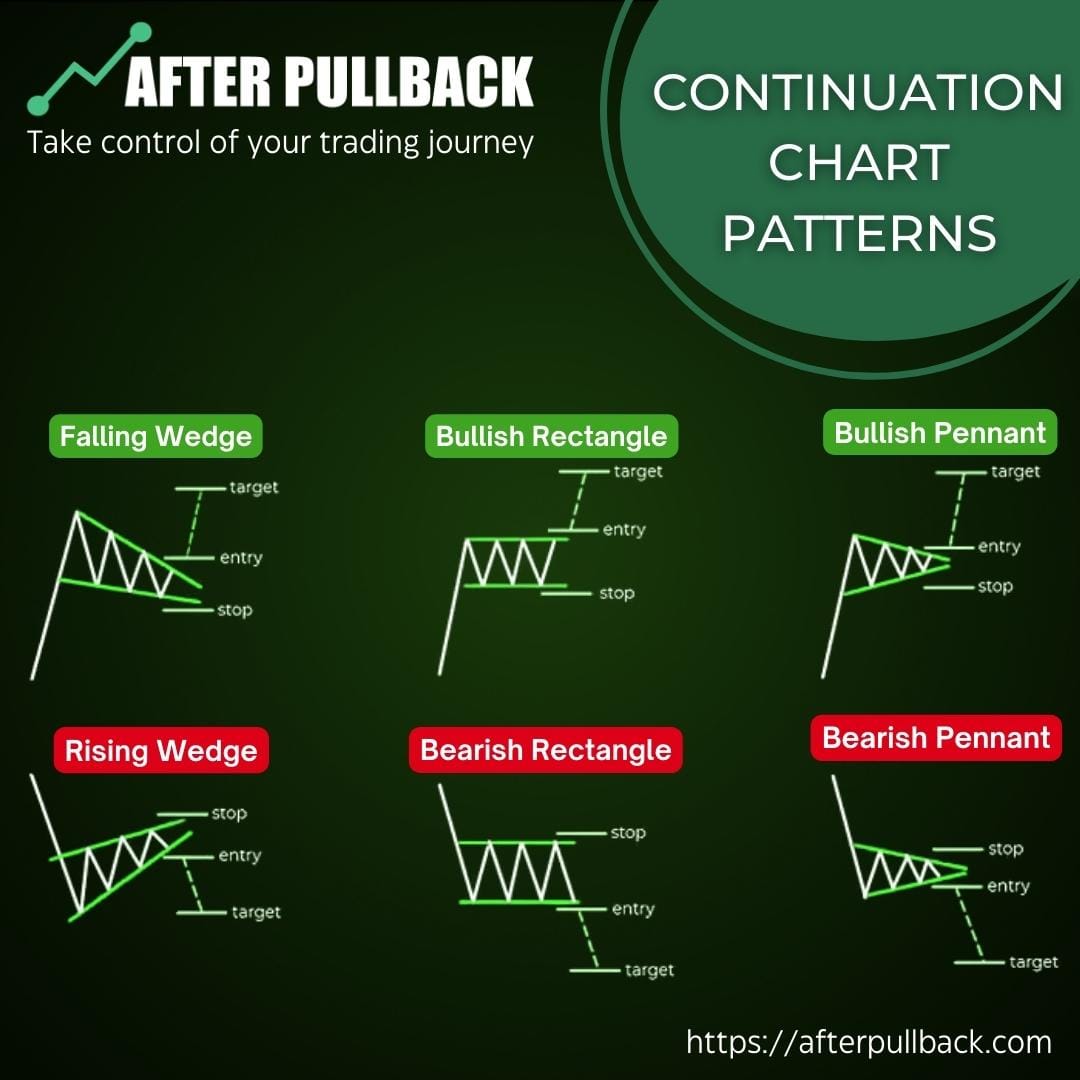
Continuation patterns are technical chart formations that also suggest a temporary pause or consolidation within an established trend (uptrend or downtrend).
These patterns don't necessarily predict the direction of the breakout, but they also indicate a period of indecision before the trend is likely to resume.
Common continuation patterns include:
Flags: These resemble rectangles with converging trendlines, suggesting a temporary pause in the trend.
Pennants: Similar to flags but with converging trendlines that meet at a point, creating a pennant-like shape.
Triangles: These come in ascending, descending, or symmetrical variations, all characterized by converging trendlines that suggest a narrowing price range.
Inside Bars Within Continuation Patterns:
The significance of inside bars is amplified when they appear within these continuation patterns. Their presence suggests an even tighter consolidation phase within the trend's pause.
Breakout Signals: If a breakout occurs from a continuation pattern that contains an inside bar, it can be a stronger signal for trend continuation compared to a breakout without an inside bar.
· Upward Breakout: In an uptrend, a breakout above the upper trendline of a flag, pennant, or ascending triangle that contains an inside bar suggests bulls might be regaining control, potentially leading to a continuation of the uptrend.
· Downward Breakout: In a downtrend, a breakout below the lower trendline of a flag, pennant, or descending triangle that contains an inside bar suggests bears might be taking charge, potentially leading to a continuation of the downtrend.
Imran Haider
Stop-Loss Placement For Inside Bars:
You would have known by now that Inside Bars are a crucial tool in Technical Analysis.
But,
For Every Trade, Risk Management should always be an important factor to conside.
So,
Lets See, where and how to put your Stop Loss with Inside Bars
The most common stop-loss placement for inside bars is on the opposite side of the mother bar:
· Upside stop: Below the low of the mother bar for long entries (breakout or reversal).
· Downside stop: Above the high of the mother bar for short entries (breakout or reversal).
For larger-than-average mother bars, some traders place their stop-loss closer, around the midpoint (50% level) of the mother bar. This can tighten risk but might get you stopped out prematurely on legitimate moves.
The placements mentioned above are a starting point.
Experienced traders may use variations based on their analysis and risk management strategies. These more advanced stop Loss could involve:
- Trailing Stops: These stops are adjusted automatically as the price moves in your favor, locking in profits and limiting potential losses.
- Volatility-Based Stops: Stop-loss levels can be adjusted based on the Average True Range (ATR) of the instrument, which measures recent volatility.
Imran Haider
What is the Ideal Time Frame for Inside Bars Patterns?
Yeah, That’s an important question as well,
But,
There's no single "ideal" time frame for inside bars that works universally.
However,
Most traders agree that higher time frames (daily or above) tend to be more reliable for using inside bar patterns compared to lower time frames (intraday charts like 1-minute or 5-minute). Here's why:
Lower time frames are susceptible to random price fluctuations and short-term volatility. This "noise" can lead to the formation of many meaningless inside bars that don't translate into significant moves. Higher time frames smooth out this noise, and the resulting inside bars are likely due to more meaningful shifts in buyer-seller dynamics.
This Leads to Stronger Signals. Because they take more time to form, inside bars on higher time frames represent a more significant pause in the trend.
And
With less noise, higher time frames tend to generate fewer misleading breakouts. This allows for more confidence in the breakout's significance when using inside bars on these time frames.
Configuring Price Action Scanners for Inside Bar Patterns
Now, At this point, Your Price Action Scanner Like the AfterPullback Scanner becomes a really handy tool to have!
You can set your price action scanner to find Specific Inside Bar Patterns and Send yourself the alert same time.
Below are some settings to give you an idea.
1: Scanner Settings for Breakout Plays
For the Identification of Breakout Plays, you can add Filters such as Trend Filters & Pattern Filters. You can even set alerts for these filters
1. Trend Filter: Moving Average Crossover (Optional)
The goal of this filter is to Identify instruments currently experiencing an uptrend or downtrend.
To Identify the trend we can use Moving averages, to smooth out price fluctuations and help us visualize the overall trend direction. For;
Uptrend Filter: Set the scanner to identify instruments where a shorter-term moving average (e.g., 50-day) is consistently above a longer-term moving average (e.g., 200-day). This suggests an upward price movement.
Downtrend Filter: Conversely, set the scanner to find instruments where the shorter-term moving average is consistently below the longer-term moving average, indicating a downtrend.
2. Pattern Filter: Inside Bar Identification
If your Scanner has this functionality, You can have the scanner automatically detect the presence of inside bar formations. These scanners will automatically identify instruments where inside bars have formed on their charts.
3. Alert Filter: Price Exceeding or Falling Below Specific Values
If you want to get notified when the price breaks out of the inside bar formation in the direction of the prevailing trend, you can configure the scanner to trigger alerts based on the breakout direction.
For an Uptrend Alert, You can Set an alert for the price to exceed (close above) the high of the mother bar for instruments identified as being in an uptrend with an inside bar formation. This suggests a potential continuation of the uptrend.
And,
For the Downtrend Alert, You can set an alert for the price to fall below (close below) the low of the mother bar for instruments identified as being in a downtrend with an inside bar formation. This suggests a potential continuation of the downtrend.
2) Scanner Settings for Support and Resistance:
Here's a breakdown of how to configure price action scanners to identify breakout opportunities using inside bars near support and resistance levels:
1. Support/Resistance Filter:
The goal of this filter is to Identify instruments currently encountering support or resistance zones.
To do this, You can have two Options
You can analyze charts and visually identify historical price points where the price has repeatedly found support (bounced higher) or resistance (been rejected).
Some scanners offer historical support/resistance level detection tools. These can automate the process of finding these levels on the chart.
2. Price Filter:
This Filter focuses on instruments where the price is currently trading near the identified support/resistance zone.
You can set a price range filter around the support/resistance level to narrow down the scanner results.
For Example, If you identify a resistance level at $100, you could set a price filter to include instruments currently trading between $98 (2% below) and $102 (2% above) resistance.
3. Pattern Filter: Inside Bar Identification
Similar to the breakout plays with inside bars section, look for scanners that can recognize inside bar patterns. This will help you identify instruments where inside bars have formed near your identified support or resistance zones.
4. Alert Filter: Price Exceeding or Falling Below Specific Values
You can set up breakout price alerts based on the support/resistance level and the trend direction:
You can set an alert for the price to exceed (close above) the support/resistance level for instruments with an inside bar formed below the resistance. This suggests a potential break above resistance and a possible trend reversal.
You can also Set an alert for the price to fall below (close below) the support/resistance level for instruments with an inside bar formed above the support. This suggests a potential break below support and a possible trend reversal.
3) Scanner Settings For Continuation Patterns:
Here's a breakdown of how to configure price action scanners to identify breakout opportunities using inside bars within continuation patterns:
1. Pattern Filter - Identifying Continuation Patterns
There are two main approaches depending on your scanner's functionalities:
Number # is , is ot watch out if your Scanners comes with Built-in Pattern Recognition. This will simplify the process.
But,
If your scanner doesn't have built-in pattern recognition,
There is still nothing to worry about.
You can achieve similar results using price filters based on the characteristics of each continuation pattern.
For Example,
Triangles tend to have a tightening price range as they develop. You can set a filter based on the Average True Range (ATR) indicator. For example, filter for instruments where the current ATR is lower than the daily average ATR. This suggests a potential triangle formation.
2. Nested Pattern Filter: Inside Bars Within Continuation Patterns
Regardless of how you identify the continuation pattern (built-in recognition or price filters), look for scanners that can also detect inside bar formations. This helps you find instruments where an inside bar has appeared within the continuation pattern, suggesting a potential pause before the breakout.
3. Alert Filter: Breakout Price Based on the Pattern
You can Set the breakout price alert based on the specific continuation pattern and the trend direction:
For example, in an uptrend flag, set an alert for the price to exceed (close above) the upper trendline of the flag. This suggests a potential continuation of the uptrend.
Conversely, in a downtrend pennant, set an alert for the price to fall below (close below) the lower trendline of the pennant. This suggests a potential continuation of the downtrend.
In the end,
Remember!
Pattern recognition is a skill that takes time and practice to develop. Backtest your strategies on historical data to assess their effectiveness before risking real capital. Stay disciplined, manage your risk wisely, and never stop learning to unlock the true potential of intraday patterns.
Trade Smarter!


