Three Most Logical Methods of Stop Loss Placement

Well,
There can be many methods to place a stop-loss
But the fact of the matter is,
When it comes to setting a stop loss,
It's not merely about following a set of rules or applying a particular formula;
it's about comprehending the market dynamics,
the risk factors and
the specific rationale
behind why and where a stop loss is placed using a particular method.
So once you grasp these fundamentals, placing a stop loss using any of the methods will be easier.
In the blog post below, we will try to find these specific reasonings behind why and where a stop loss is placed using Some Popular Methods
But, for those of you who don't know, we will start with the most basic question first,
What is a stop-loss Order?
Stop-loss orders limit potential losses by automatically selling an asset when its price falls to a certain level. However, there is a risk that like market orders (selling at whatever best market price available) it Can lead to poor pricing due to market gaps (bid-ask spread) or overnight drops. The solution? Use Stop Limit which limits maximum loss by Setting a price cap on stop-loss execution, avoiding bad fills. There is a risk of Potential non-execution with stop limits as the order might not be filled if the desired limit price isn't available. These strategies have been discussed in detail in the blog The importance of stop loss in trading and how to use it correctly. You can have a look!
The Three Most Commonly Used Methods to identify and place stop losses are ;
1. Support and Resistance Levels:
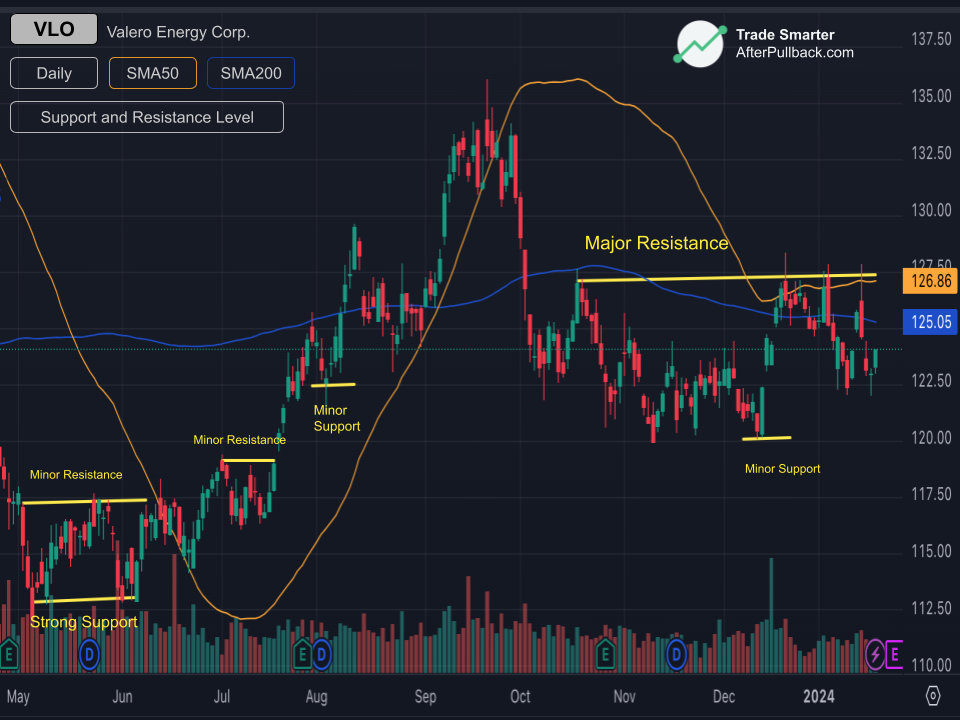
Support levels are price levels at which a financial instrument, such as a stock or currency pair, has historically found buying interest, preventing the price from falling further. Traders often observe these levels as floors where the demand for the asset increases.
On the other hand, resistance levels are price levels where the asset has historically encountered selling pressure, preventing the price from rising. Traders see these levels as ceilings where supply tends to increase.
These levels are identified based on historical price behavior. Traders analyze charts to pinpoint areas where the asset has previously reversed direction.
Support and resistance levels also have a psychological impact. Traders and investors often remember these levels, leading to increased buying or selling activity when prices approach them.
How does Stop Loss work with support and Resistance levels?
Stop Losses against a Support and resistance level is
a Protection Against Breakdowns
Placing a stop in the area just below a support level is a precautionary measure. If the price breaks below support, it may signify a potential trend reversal. Setting the stop below this level helps protect against further downside.
Similarly, they also,
Avoid False Breakouts!
Placing a stop just above a resistance level helps guard against false breakouts. If the price briefly surpasses resistance but then retreats, it may indicate a failed breakout. Setting the stop above this level helps mitigate losses in such scenarios.
How do you place Stop Loss based on support and Resistance Level?
Before we move to explain the mechanism of placing the stop loss, Here is a word about Support and Resistance Level.
Remember,
Now back to the topic,
The First Step in placing a stop Loss Level is
Identification
Where traders Identify the support and resistance level.
Traders use technical analysis tools such as charts, trendlines, and moving averages to identify support and resistance levels.
Once the Support and resistance levels are identified,
The Next Step is
Determination of Risk Tolerance
This step determines how much loss you will tolerate on the trade. This will influence where you place your stop-loss.
The third step is;
Placement
Where you Place Stop-Loss Below Support or Above Resistance
If you are going long (buying), place your stop-loss just below the identified support level. If the price drops below support, it may indicate a significant trend reversal.
If you are shorting (selling), place your stop-loss just above the identified resistance level. If the price breaks above resistance, it may signal a potential upward trend.
The fourth step is;
Confirmation
Where you use some Technical Indicators for Confirmation:
Reconfirming your findings is necessary, SO you should Consider it, for example, by using technical indicators (such as Moving Averages, RSI, MACD) to confirm the strength of support or resistance levels before placing your stop-loss.
And the last step is
Review and Adjustment as Necessary:
You need to regularly review your trades and adjust your stop-loss levels as the market evolves. This could involve tightening the stop-loss if the trade is in your favor or adjusting it to account for new support/resistance levels.;
Here is a simplified example for your understanding;
- Suppose you're looking at the daily chart of Stock ABC and notice that $50 has been a strong support level and $60 is a resistance level. The stock tends to bounce off $50 and struggles to move above $60. (Step1- Identification)
- You Decide that you are willing to risk $3 per share on this trade (Step 2- Risk Tolerance)
- If you plan to go long (buy) Stock ABC, you can place your stop-loss below the support level at $47 ($50 - $3). This is to give the stock some room for natural fluctuations but to exit if it breaks the significant support level (Step 3- Placement)
- You must Confirm the support level using technical indicators like Moving Averages. If the 50-day moving average aligns with the $50 support, it adds strength to that level. (Step 4- Confirmation)
- Then, you Regularly review the trade. If Stock ABC has risen and is now testing the $55 level, you might adjust your stop-loss to $52 to lock in some profits and protect against a reversal. ( Step 5- Review and Adjustment)
 Imran Haider
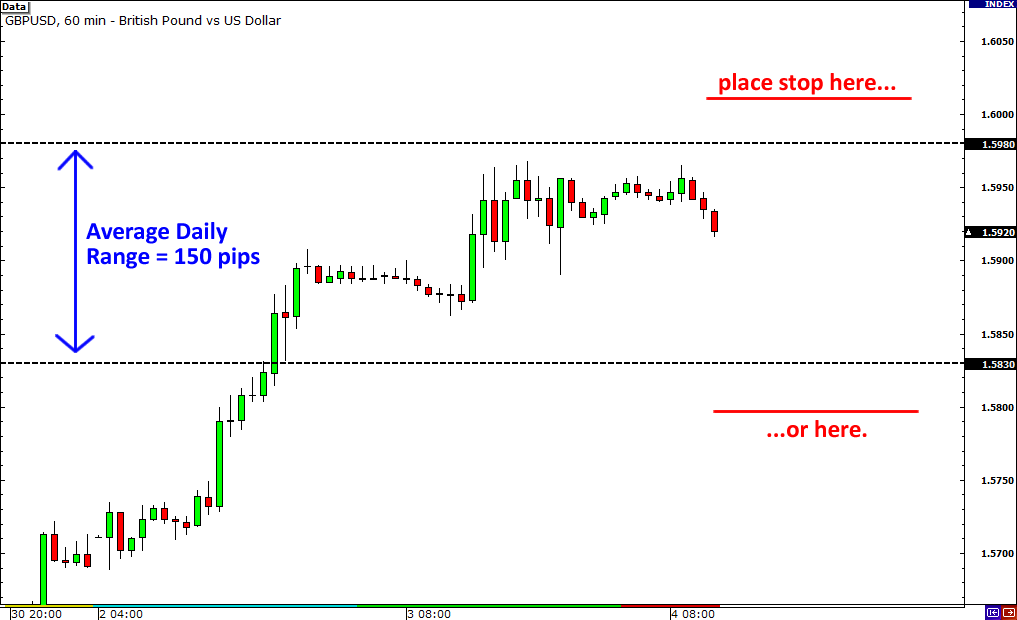
2. Volatility-Based Stops:
What is Volatility?
Volatility refers to the degree of variation of a trading price series over time. Highly volatile assets experience larger price swings, while less volatile ones exhibit more stable and smaller price movements.
Setting Stop Loss based on Volatility serves two benefits;
First, It lets you place wider Stop Losses for more Volatile assets.
Setting wider stop-loss levels can be appropriate when an asset is known for higher Volatility. This accommodates the larger price swings, reducing the likelihood of being stopped due to normal market fluctuations.
Second, It Avoid Premature Exits due to market noise.
A common challenge with volatile assets is the risk of premature exits caused by normal market noise. Wider stops provide more room for the price to oscillate within a trend, avoiding unnecessary exits triggered by minor price movements.
How to Calculate Volatility:
For Volatility Calculation, We generally use two methods
Average True Range (ATR):
Traders often use indicators like the Average True Range (ATR) to quantify an asset's Volatility. ATR measures the average price range between high and low over a specified period. Higher ATR values indicate higher Volatility and vice versa.
Percentage of Price:
Alternatively, Volatility can also be assessed as a percentage of the current price. This method helps standardize Volatility across different assets, making comparing and applying consistent risk management easier.
How to Put Stop Loss Based on Volatility?
To Place a stop Loss based on Volatility,
The First Step is to determine your Risk Tolerance
Determine your risk tolerance based on the Volatility of the asset. This can be a fixed percentage of the asset's price or a multiple of its ATR.
Let's say you are a trader interested in buying shares of a stock Priced at $100, and you want to establish your risk tolerance before entering the trade.
If You are Using a Fixed Percentage of the Asset's Price as a measure of Volatility,
You may decide on a risk tolerance of 2% of the stock's price.
Then, the dollar amount at risk (your risk tolerance level) will be calculated as follows:
Risk= Stock Price× Risk Percentage
Risk = $100 x 2% = $2
In this case, your risk tolerance is $2 per share.
This $2 represents the amount of money you are willing to risk per share of the stock. If the stock's price moves against your trade and reaches the defined risk level (in this case, $2), you could exit the trade to limit your losses.
Alternatively, If you decide to set Stop Loss based on Volatility using ATR,
And you see the same stock priced at $100. You will also observe the Average True Range - ATR of this asset.
Let's say that the last 14 days generated for the stock ATR ranged at 3 points (3$ price range, since its stock) on the daily timeframe..
Seeing this Volatility, You choose a risk multiple of 1.5 times the ATR.
Now, your dollar amount at risk will be calculated as follows:
Risk= ATR × Risk Multiple
Risk = $3 x 1.5 = $4.50
In this case, your risk tolerance, based on ATR, is $4.50.
If the stock's price moves against your trade and reaches the defined risk level (in this case, $4.50), consider exiting the trade to limit your potential losses.
Did you notice one particular thing?
This approach allows you to adapt your risk to the varying levels of Volatility in the market, providing a more dynamic risk management strategy.
The Second Step is to set Stop Loss based on your risk tolerance level;
This is a relatively simple step once the risk tolerance level is determined; you set the stop loss level based on the Percentage or the risk multiple calculated using ATR.
The last step is the Regular Review.
As you saw in the support and resistance level above, You have to Regularly reassess the Volatility of the asset and adjust stop-loss levels accordingly.
Why?
Because the Market conditions can change, and what may have been appropriate in one period may need adjustment in another. Events like earnings reports, economic data releases, or geopolitical developments can significantly influence market dynamics.
Keeping an eye on the market for any such event becomes crucial.
3. Moving Averages:
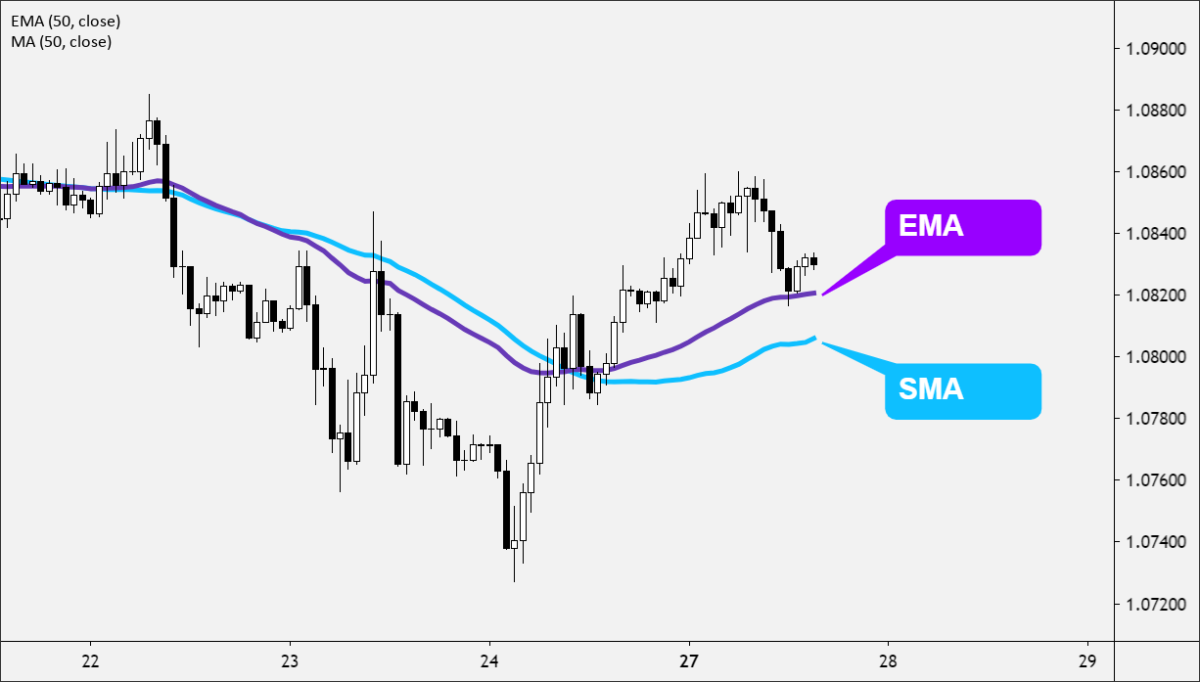
Moving averages, whether simple moving averages (SMA) or exponential moving averages (EMA), are dynamic lines that reflect the average price over a specified period. In trending markets, they can act as dynamic support (in an uptrend) or resistance (in a downtrend).
They also help in trend identification.
Moving Averages make it easier to identify the direction of the prevailing trend. Crossing above or below a moving average may signal the initiation or reversal of a trend.
They are widely used in technical analysis to identify trends. Placing stops based on moving averages can help traders capture trends effectively while mitigating the impact of false signals.
How do you set up Stop Loss based on Moving Averages?
The process is completed in the following steps.
The First Step is to Select the Moving Average Type:
Choose between a simple moving average (SMA) or an exponential moving average (EMA) based on your preference and the characteristics of the asset. EMAs react more quickly to recent price changes, while SMAs provide a smoother average.
For example, If you select two EMAs, such as a shorter-term EMA (e.g., 10-day) and a longer-term EMA (e.g., 50-day). The shorter EMA responds quickly to price changes, while the longer EMA provides a broader trend perspective.
The next step is to Identify the Trend Direction:
You have to determine the prevailing trend direction by observing the relationship between the price and the moving average.
In an uptrend,
the shorter-term Exponential Moving Average (EMA) is positioned above the longer-term EMA. This relationship signifies that recent price movements carry more weight in calculating the shorter EMA. As a result, the shorter EMA reacts more quickly to changes in the underlying asset's price. This configuration indicates a bullish market sentiment where prices are generally rising.
Traders and investors often interpret the shorter EMA being above the longer EMA as a signal to consider long positions or to maintain existing long positions. The recent price momentum is strong, supporting the prevailing upward trend.
Conversely,
In a downtrend,
the shorter EMA is positioned below the longer EMA. This arrangement reflects that recent price movements significantly impact the shorter EMA, making it more responsive to short-term changes. A downtrend implies that prices are generally decreasing over time.
When the shorter EMA crosses below the longer EMA, it is often considered a signal for potential weakness in the current trend. Traders may interpret this as a cue to consider exiting or selling positions, suggesting a shift in sentiment toward bearish conditions.
The last step is to Set the Stop Loss Order;
In this last step, you place stop-loss orders just below a rising moving average for long trades (uptrend) or just above a falling moving average for short trades (downtrend). This helps protect against potential trend reversals.
For Long Trades (Uptrend):
Marked by rising prices, Most traders place a stop-loss order just below the ascending Short-Term Exponential Moving Average (EMA).
By situating the stop-loss just below the ascending Short-Term EMA, traders seek to safeguard against potential trend reversals. A drop in the price below the Short-Term EMA could signal a weakening uptrend. The stop-loss order serves as a precautionary measure, initiating a trade exit to limit losses if there's a shift in trend dynamics.
This strategy aligns with the principle that the uptrend is deemed intact as long as the price remains above the ascending Short-Term EMA. A breach of this level may signify a change in market sentiment, prompting the implementing of a protective exit strategy.
For Short Trades (Downtrend):
Most traders place a stop-loss order where prices are generally descending, just above the descending Long-Term Exponential Moving Average (EMA).
Placing the stop-loss just above the descending Long-Term EMA aids in managing risk in the face of potential upward retracements or short-term reversals. Increasing the price above the Long-Term EMA may suggest a weakening downtrend. The stop-loss order serves as a protective measure, facilitating a trade exit if there's a shift in trend dynamics.
What else do you consider when placing a stop-loss order using these methods?
Be Mindful of
The time frame selection
Using any of the methods above depends on what type of trader you are.
You have to Choose the appropriate timeframe based on your trading horizon. Your trading time frame can influence the placement of stop-loss orders. Short-term traders may use tighter stops, while long-term investors might opt for more generous levels.
Try to use these methods in
Combination with Other Indicators
When implementing a trading strategy, it's valuable to complement the approach by incorporating additional technical indicators.
For example,
Using the Moving Average Convergence Divergence (MACD) alongside moving averages can help assess the momentum behind a trend, adding an extra layer of insight.
Similarly,
Unusual volume spikes in conjunction with a moving average crossover, for instance, can also provide strong signals of trend initiation or potential trend reversal.
Apart from these three methods, Setting Stop loss based on chart Patterns and trendlines is also a popular method. We have covered this in detail in our blog 10 Common Chart Patterns That Every Trader Should Know Of. Go, Have a look at it as well!
Conclusion:
After exploring various strategies and considerations, You might have noticed that there is no one-size-fits-all solution when finding the most logical method of stop loss placement.
Instead, effective risk management is the key,
Integration of chosen methods with a deep understanding of market dynamics, risk tolerance, and the underlying principles guide stop-loss decisions. This approach acknowledges the diversity of trading styles, asset classes, and market conditions, emphasizing the importance of adaptability and strategic flexibility.
So, for Sustained Success,
You have to
Trade Smarter!
But before you go, as we generally do, here are some quick,
Frequently Asked Questions (FAQs)
Question: What is the 3 5 7 rule in trading?
Answer: The 3-5-7 rule is a risk management guideline suggesting a 3% risk per trade, a maximum total risk of 5%, and closing out after seven consecutive losing trades.
Question: What is the golden strategy for intraday trading?
Answer: There isn't a universally agreed-upon "golden" strategy, but common intraday strategies include trend following, range trading, and breakout strategies.
Question: How do you place a stop loss and limit order at the same time?
Answer: You can use an OCO (One Cancels the Other) order to simultaneously set a stop-loss and take-profit level, ensuring that one order cancels the other upon execution.
Question: Can you place a stop loss on options?
Answer: Yes, you can place a stop loss on options, similar to stocks, to limit potential losses in case the option price moves against your position. However, keep in mind that options are less liquid, the asset changes less hands, and the stop, that based on a market order, can be executed at a greater price range than the targeted stop price
Question: What is the rule of thumb for stop loss?
Answer: A common rule of thumb for stop loss is to set it at a level where you're comfortable risking a small percentage of your trading capital, often between 0.X% and up to around 3%.
Question: Does Warren Buffett use a stop loss?
Answer: Just like a car racer and bus driver, both use the road as a platform, yet their professions are vastly different. In the same way, long-term investors and short-term traders both utilize the stock market, but their approaches and goals are distinct.
Take Warren Buffett, a prime example of a long-term investor, not a short-term trader reliant on technical triggers. His "stop-loss" is defined by fundamental factors tied to the company's health, rather than technical chart signals favored by short-term traders.
Question: How do you place a stop loss and take profit?
Answer: To place Stop-Loss and Take profits at the same time, you can use an advanced order called OCO-Order-Cancel-Order.
This order has 2 linked orders
1) Stop-Loss order, to stop the loss
2) Limit, targeted to take profits
When the price reaches any of them, it will cancel its linked order to close the trade or part or it. We have explained this in detail in our blog Stock Market Orders: Types & How to Manage Risk with Them .


