Three Common Methods to identify exit signals with price action scanners

Most traders in the market encounter this dilemma, the guessing game with the markets.
Situations, where You buy a stock that's going up, but then….. it just keeps going... making you guess when to exit the trade.
The mind buzzes with questions like, is this the big one, or are you about to get burned?
What if you could identify signs that a trend might be ending before you lose all your profits? Wouldn’t it be great?
You see, exiting a trade at the right time is just as crucial, the difference between locking in profits and watching them evaporate.
This blog below discusses how price action scanners can be a valuable tool for spotting exit signals.
By leveraging price action scanners for exits, you can:
1. Ditch the gut feeling and rely on data-driven signals.
2. Spot potential moments to lock in profits or get early warnings of potential losses.
3. Make smarter exit decisions that align with your risk management plan.
Let's move on!
How to Spot Exit Signals with price action scanners?
We all know that you can Spot Entry Signals with Price Action Scanners
However, Price action scanners can also be a valuable tool to help you identify potential exit points for your trades.
Here are 3 most common methods to leverage them effectively:
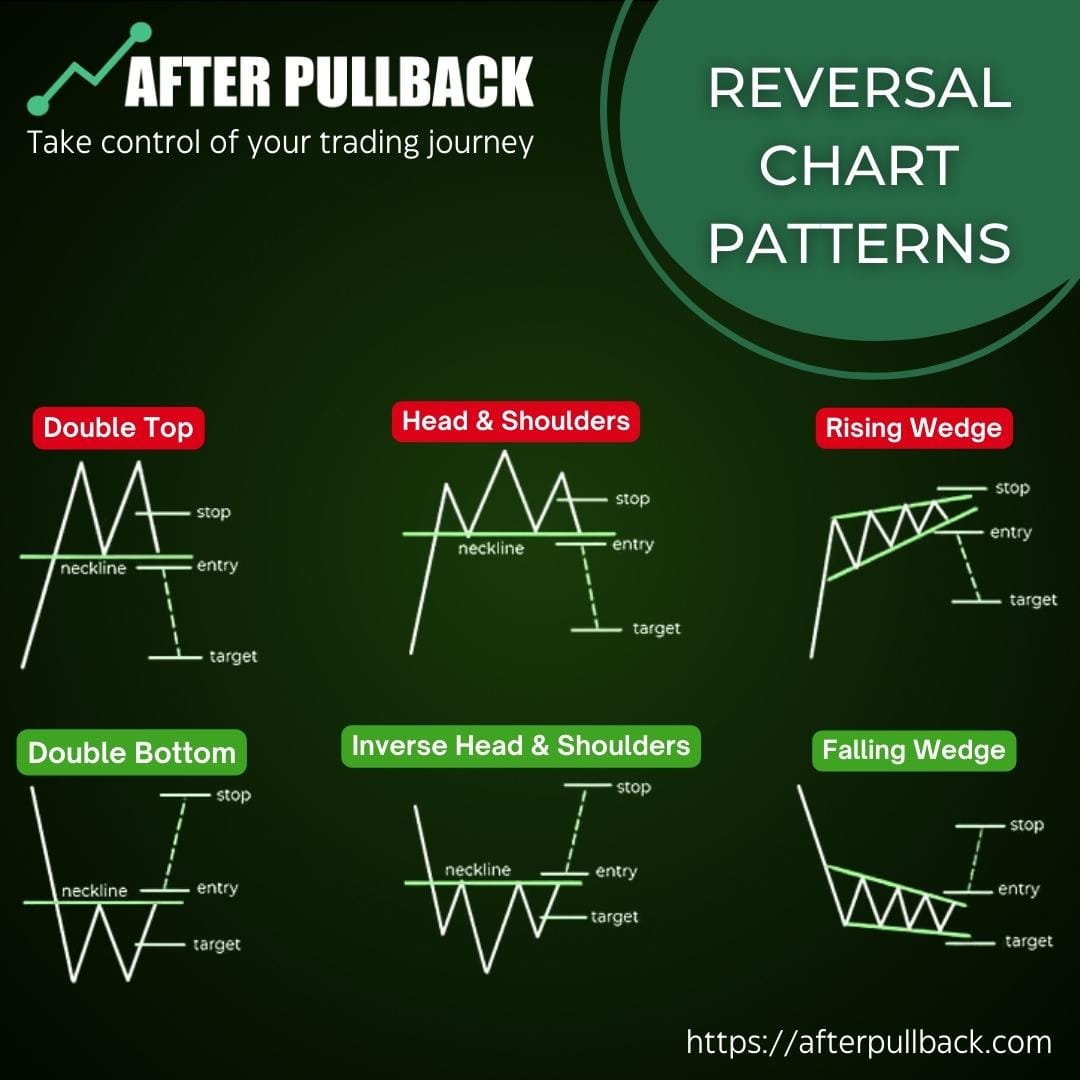
1. Scan for Reversal Patterns
2. Identify Support and Resistance Levels
3. Monitor Moving Averages
We will discuss each of these factors in detail below. We will also see what kind of filters to apply in your price action scanners to make these signals work.
1. Scan for Reversal Patterns:
Reversal patterns are technical indicators that suggest a potential shift in the current price trend, either from an uptrend to a downtrend or vice versa. They don't guarantee a reversal, but they highlight areas on the chart where the bulls (buyers) and bears (sellers) might be battling it out, potentially leading to a change in direction.
Some of them like the two below are the common chart patterns that every trader should know of. The purpose of giving them here is just to give you an idea of how to work around them.
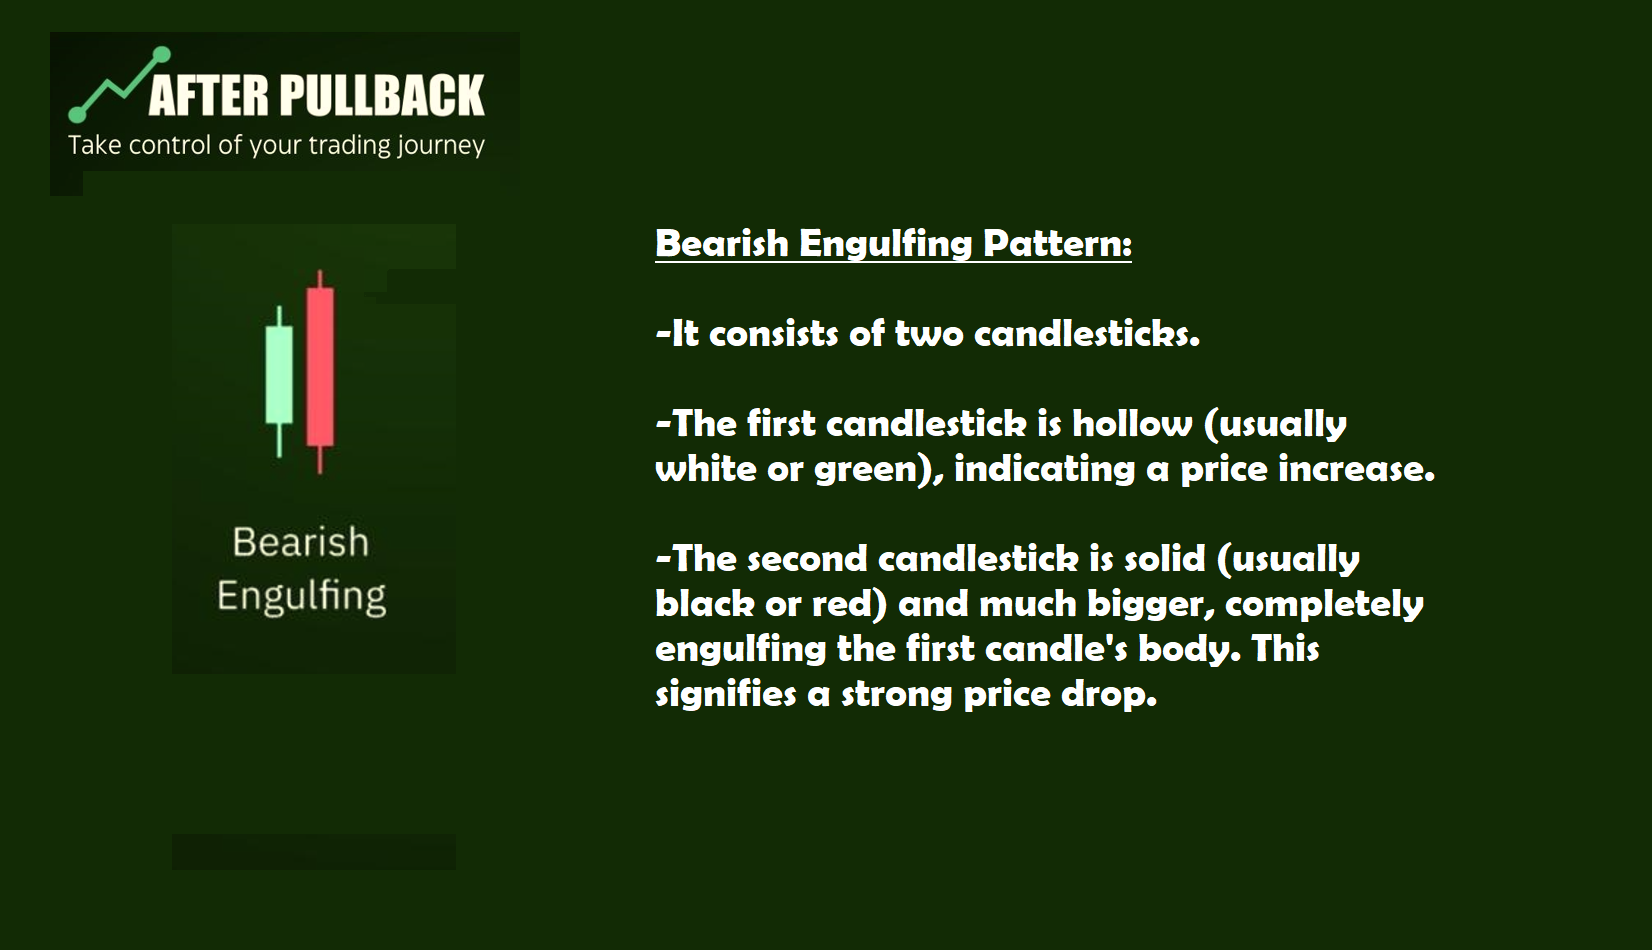
i) Bearish engulfing patterns:
In technical analysis, a bearish engulfing pattern is a two-candle candlestick formation that signals a potential downturn in a price trend. It's like a warning sign from the market, hinting that the bulls (buyers) might be losing momentum to the bears (sellers).
Here's the breakdown:
- It consists of two candlesticks.
- The first candlestick is hollow (usually white or green), indicating a price increase.
- The second candlestick is solid (usually black or red) and much bigger, completely engulfing the first candle's body. This signifies a strong price drop.
Basically, the bigger red/black candle "swallows" the smaller white/green candle, suggesting the buyers are losing power and sellers are taking over. This could be a sign that the uptrend is ending and a downtrend might be starting.
How to configure price action scanner to identify Bearish engulfing patterns:
So, how do you tell your price action scanner to specifically look for those bearish engulfing patterns? Most scanners let you set custom filters based on candlestick formations. Here's what you'll want to tweak in your scanner:
Lookback Period will tell the scanner how far back in time to search for the pattern. Since a bearish engulfing is a two-candle setup, a common setting is just 2 candles.
Candle Direction: First, you'll need to tell the scanner what to look for in the first candle. Set this to "Bullish" (or whatever term your scanner uses for an upward green body).
Second Candle: Now for the big change! Set this to "Bearish" (or the equivalent for a downward red body).
Engulfing Power: Look for an option related to engulfing patterns. It might be called "Engulfs Previous Body" or something similar. This ensures the big red candle completely swallows the first one.
Strength of the Bear: You can also set a minimum size requirement for the bearish candle's body. A bigger red body suggests a stronger selling pressure.
ii) Head and Shoulders
Again, Although there are many patterns out there , but we have chosen this one, just to give you an idea of the whole process.
A head and shoulders pattern is used to identify potential trend reversals, typically from uptrends to downtrends. It resembles a human head with two shoulders:
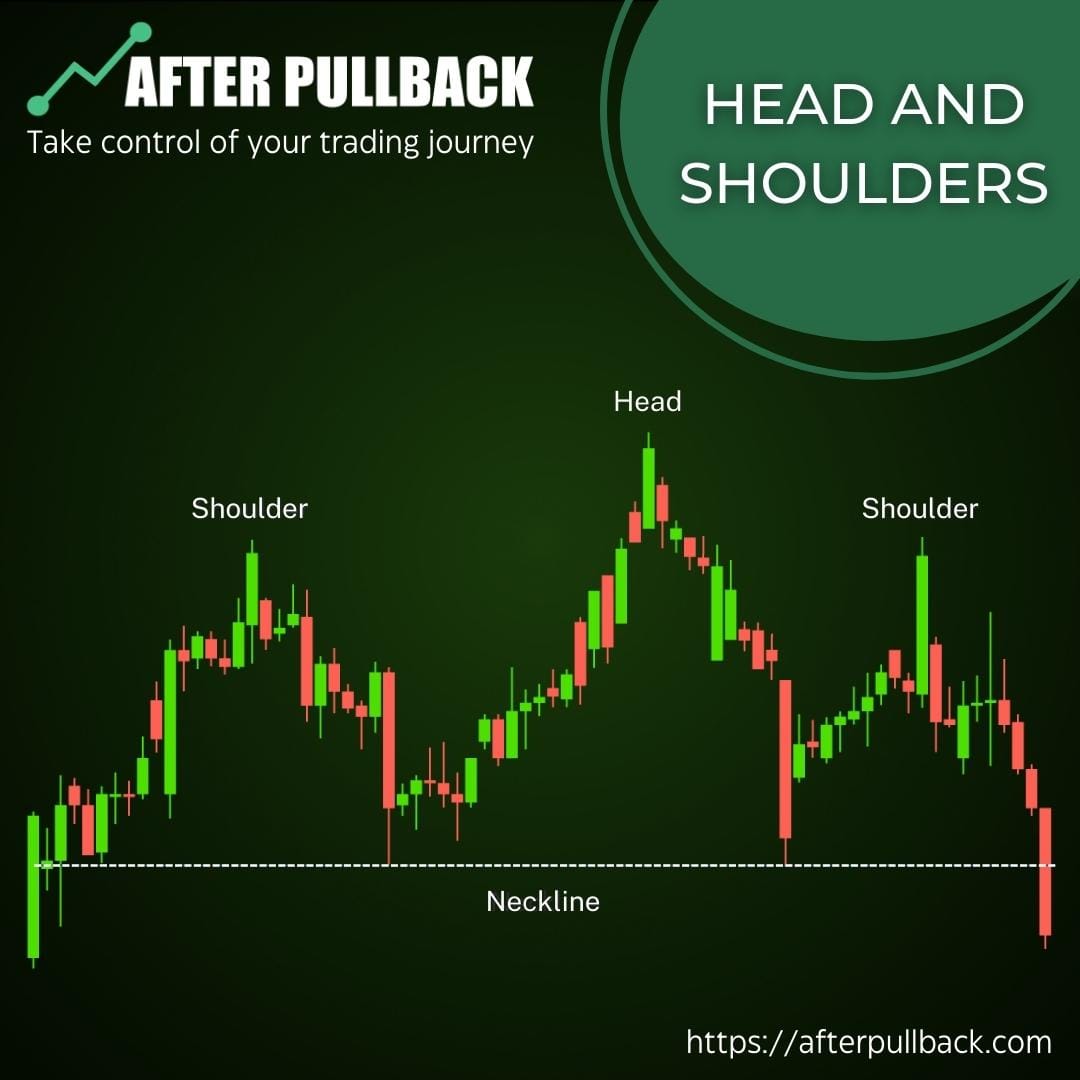
- Head: The middle peak is the highest point, representing a temporary peak in price.
- Shoulders: The two outer peaks are lower, indicating potential reversals.
This pattern suggests a potential trend reversal, from uptrend to downtrend. Here's how it identifies an exit signal:
- Neckline: A trendline connecting the lows of the shoulders. A break below the neckline is the key exit signal.
Target Price: Measure the distance from the head (highest peak) to the neckline. This distance is often projected downwards from the neckline break to estimate a potential price target for the downtrend.
So, if you're in a long position (buying) during an uptrend and see a head and shoulders pattern forming, the break below the neckline would be your signal to exit the trade and potentially avoid further losses.
Configuring a Price Action Scanner for Head and Shoulders Patterns
Price action scanners can be a helpful tool for identifying potential head and shoulders (H&S) patterns, which can signal a trend reversal and be a valuable exit strategy indicator. Here's how to configure your scanner:
Scanner Settings defines how many candles back the scanner will search for the pattern. A common starting point is 20-50 candles, which allows the scanner to capture the entire H&S formation (left shoulder, head, right shoulder, and neckline).
Many scanners allow defining specific candlestick patterns. You might not find a dedicated "Head and Shoulders" option, but you can achieve this by combining individual components:
Left Shoulder: Set this to identify a swing high (typically a bullish candlestick with a prominent upper wick).
Head: Set this to identify a higher swing high (often a bullish candlestick) compared to the left shoulder.
Right Shoulder: Set this to identify a swing high (typically bullish candlestick with an upper wick) that's ideally lower than the head but at least somewhat close in height.
Neckline: This is a crucial element of the H&S pattern. Look for an option related to horizontal lines or trendlines. You can define the criteria for the slope (ideally flat or slightly downward) and potentially the number of times the price has touched the line (indicating support in an uptrend).
Volume: Consider including a filter for decreasing volume on the right shoulder compared to the head. This reinforces the weakening uptrend.
Confirmation: Some scanners might offer an option for a "breakthrough" of the neckline (price closing below the neckline for a downtrend). This can be a confirmation of the H&S pattern and a stronger exit signal.
Here is a cheat sheet for other reversal patterns!

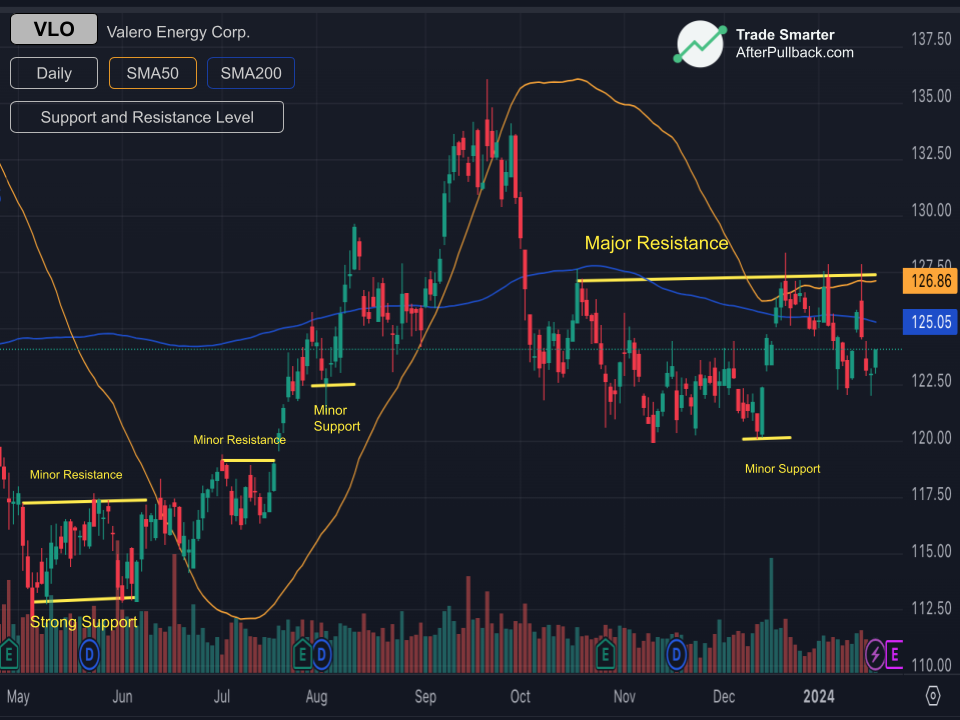
2) Support and Resistance Levels
Support and resistance levels indicate areas where the price movement might pause or reverse. Support is a price level where buying pressure is typically strong enough to prevent the price from falling further . Resistance, on the other hand is a price level where selling pressure is typically strong enough to prevent the price from rising further. Think of it as a ceiling that the price has difficulty breaking through. A Trade setup based on Support and Resistance levels has a higher chance of success.
What can be the exit signals with Support and Resistance?
If the price decisively breaks above a resistance level in an uptrend, it might signal a continuation of the uptrend, potentially prompting some traders to exit long positions (buying) to lock in profits. Conversely, a break below a support level in a downtrend could indicate a potential acceleration of the downtrend, leading some traders to exit short positions (selling) to take profits.
How to configure Price Action Scanners to identify exit signals based on Support/Resistance levels?
Most scanners allow you to analyze historical price data and highlight potential support and resistance zones. This can be done through various methods:
Number 1, You can manually draw horizontal lines at key price points where the price has repeatedly bounced or paused in the past. Scanners might offer tools to automate this process to some extent, identifying recurring price points.
Additionally,
Some scanners offer built-in support/resistance indicators like Bollinger Bands® or Pivot Points. These can help visualize potential support and resistance zones based on volatility or pre-defined calculations.
Another way in which a price action scanners can be helpful is in Setting Up Breakouts Alerts!
You see, Once you've identified potential support and resistance zones, configure breakout alerts:
For example, In an uptrend, you can program an alert to trigger when the price decisively breaks above a resistance level. This could signal a continuation of the uptrend, but for some traders, it might also be an exit point to lock in profits from long positions (buying).
Similarly, In a downtrend, you can program an alert to trigger when the price decisively breaks below a support level. This could indicate an acceleration of the downtrend, prompting some traders to exit short positions (selling) or avoid further losses.
You can also Customize Alert Parameters (Optional):
Depending on your scanner's capabilities, you can further refine your alerts using additional parameters:
For example, the Volume Filters!
You can consider incorporating volume filters to your breakouts. A strong breakout with high volume might be more reliable than a weak breakout with low volume.
You can also set the timeframe for breakouts. An hourly breakout might be less significant than a daily breakout for some traders.
3) MOVING AVERAGES
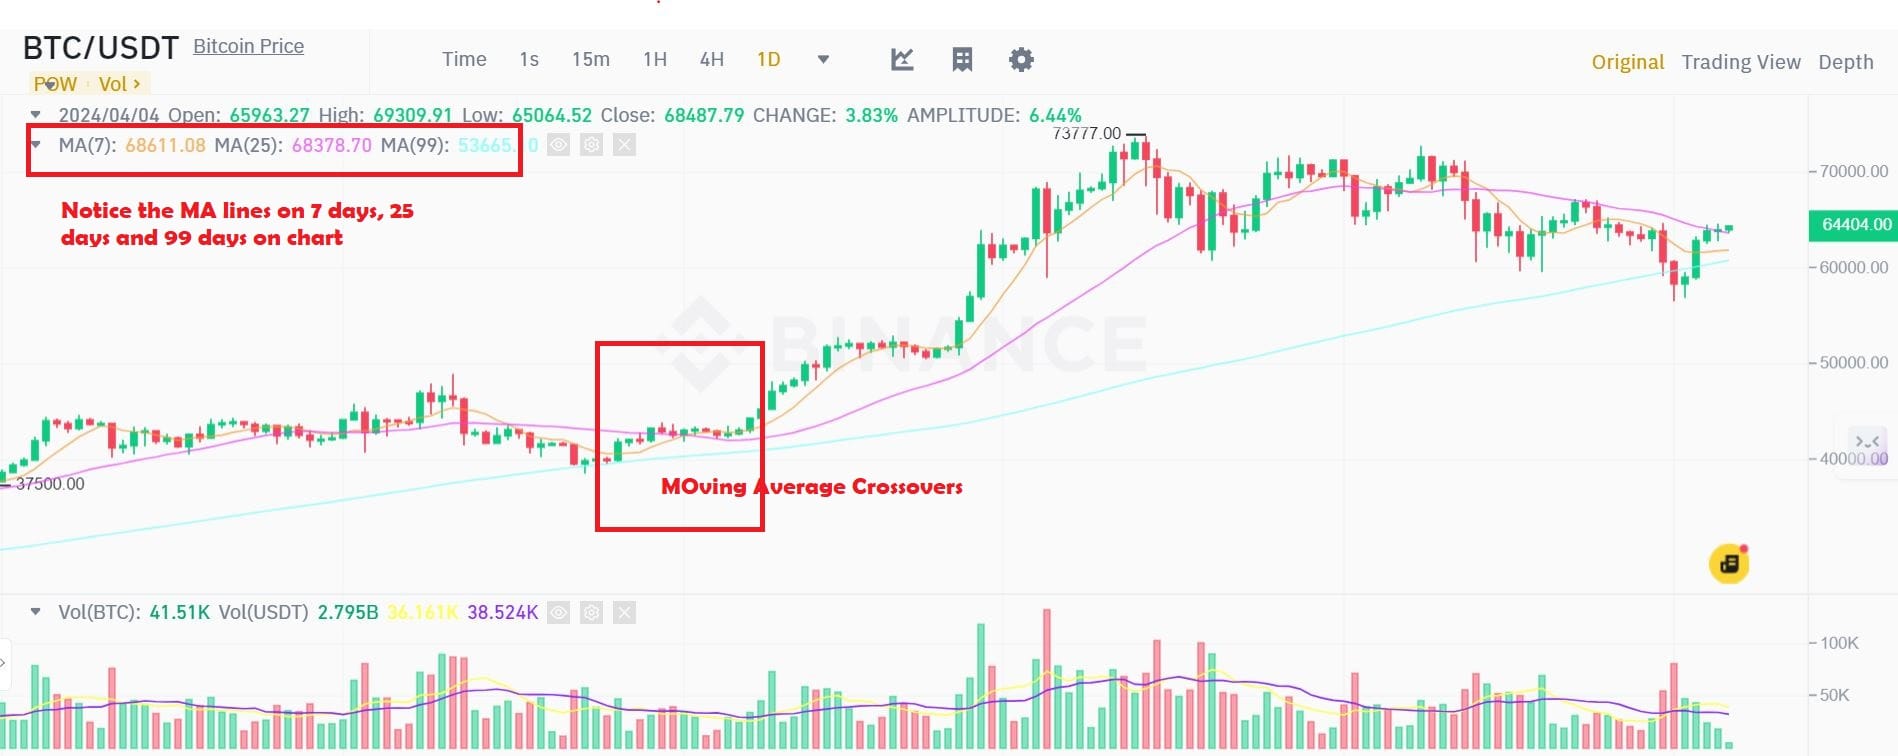
Moving averages (MAs) are a popular technical analysis tool that smooths out price fluctuations and help visualize the underlying trend. They're calculated by averaging the price of an asset over a specific period (e.g., 50 days, 200 days).
How Moving Averages Indicate Exit Signals?
The answer is , through Crossovers!
When a shorter-term moving average crosses below a longer-term moving average in an uptrend, it might suggest a weakening trend and a potential exit point for long positions (buying).
Conversely,
a crossover where the shorter-term MA rises above the longer-term MA in a downtrend could signal a potential trend reversal and an exit for short positions (selling).
Moreover,
The slope of the moving average itself can also be informative. A flattening moving average in an uptrend might indicate a loss of upward momentum, prompting some traders to exit.
How to Identify Exit Signals with Price Action Scanners?
Price action scanners can be valuable tools for identifying moving average signals. Scanners can automatically plot various moving averages on a chart, allowing traders to easily visualize trends and potential crossovers.
Similarly,
Scanners can also be programmed to send alerts when moving average crossovers or slope changes occur, potentially signaling buying or selling opportunities depending on the context.
Remember: Moving averages are lagging indicators, meaning they react to past price movements. Combining them with other technical analysis tools and a solid risk management strategy can help you make more informed exit decisions.
In Conclusion
Remember,
Successful trading is about making informed decisions at the right time. These scanner-powered techniques can equip you to spot potential trend changes, identify breakouts and breakdowns, and ultimately, make strategic exits to maximize your profits and minimize losses.
So,
put these methods to the test, and unlock the full potential of your price action scanner for smarter trading decisions!
Trade Smarter!


