Swing Trading: How Stock Scanners Can Help in Identifying Opportunities

“Turning Volatility into Opportunity”
This is what a swing trader strives to do!
In Financial Markets, where fortunes are made and lost with each tick of the clock, there is no denying that a systematic approach to trading is paramount.
Unlike day trading's rapid-fire pace or long-term investing's patient endurance, swing trading strikes a balance between the two, capitalizing on short to medium-term price movements. The strategy is all about capturing the "swings" in asset prices that unfold over days, weeks, or even months.
This blog explores the nature of swing trading and focuses on stock screeners' role in swing trading. It explores how these powerful tools empower traders to cut through the noise and focus on the assets with the most significant potential for profitable moves.
So, let's start!
What is Swing Trading?
Swing trading is a trading strategy that captures price swings in stocks over a relatively short to medium-term horizon. Unlike day trading, where traders open and close positions within a single trading day, swing traders typically hold their places for several days or weeks.
At the heart of swing trading lies the ability to identify and capitalize on the price fluctuations that occur as stocks move in and out of trends. Swing traders aim to buy stocks when they anticipate an upward price swing and sell them when they expect a downward swing.
Also Read: Why Proper Trading Strategy Management Is Essential For Long-Term Success
Here is how the Swing Trading ranks with others on time Horizons;
The Toolbox of Swing Trading: The Indicators, Screeners and Scanners
Swing traders commonly use a variety of technical indicators to analyze price movements and make informed trading decisions.
Stock scanners and stock screeners are tools that swing traders often employ to facilitate the application of these technical indicators in their trading strategies.
So, before we move into the details of these indicators,
here is an important question, often confusing the minds of the traders.
What is the difference between Stock Screeners and Stock Scanners?
Stock Screeners analyze historical data, or we can say data at a particular moment, to filter and screen financial instruments based on specific criteria, helping investors identify investments or opportunities. These criteria may include fundamental factors (earnings, revenue) and technical factors (price-to-earnings ratio, moving averages), catering to different investment strategies.
E.g. A market screener could be used to identify long-term investment opportunities, such as filtering for stocks with consistent revenue growth over the past five years, highlighting a stock like Amazon (AMZN).
The Scanners, on the other hand, typically focus on criteria related to real-time market data, such as volume spikes, price changes, or technical indicators signaling potential trades.
E.g. A market scanner might identify a stock like Tesla (TSLA) for immediate action based on real-time criteria, such as a sudden price spike or unusual volume.
Efficient Market Scanners, Like AfterPullBack Market Scanner, lets you set the scanner conditions based on different sets of data like your pre-defined and backtested strategy, it can also be based on different indicators and common chart patterns, volume, with a combination of fundamental data such as stock market-cap and more.
Once connected to the trading signals, It can give you real-time notification when a stock meets your criteria. A Scenario ideal for Short Term Trading!
and going back to our topic now, lets see what are the most;
Widely Used Indicators in Swing Trading:
Here are some of the most widely used indicators in swing trading . Lets see how stock screeners can be used to identify the opportunities for successful swing trades.
1. Moving Averages:
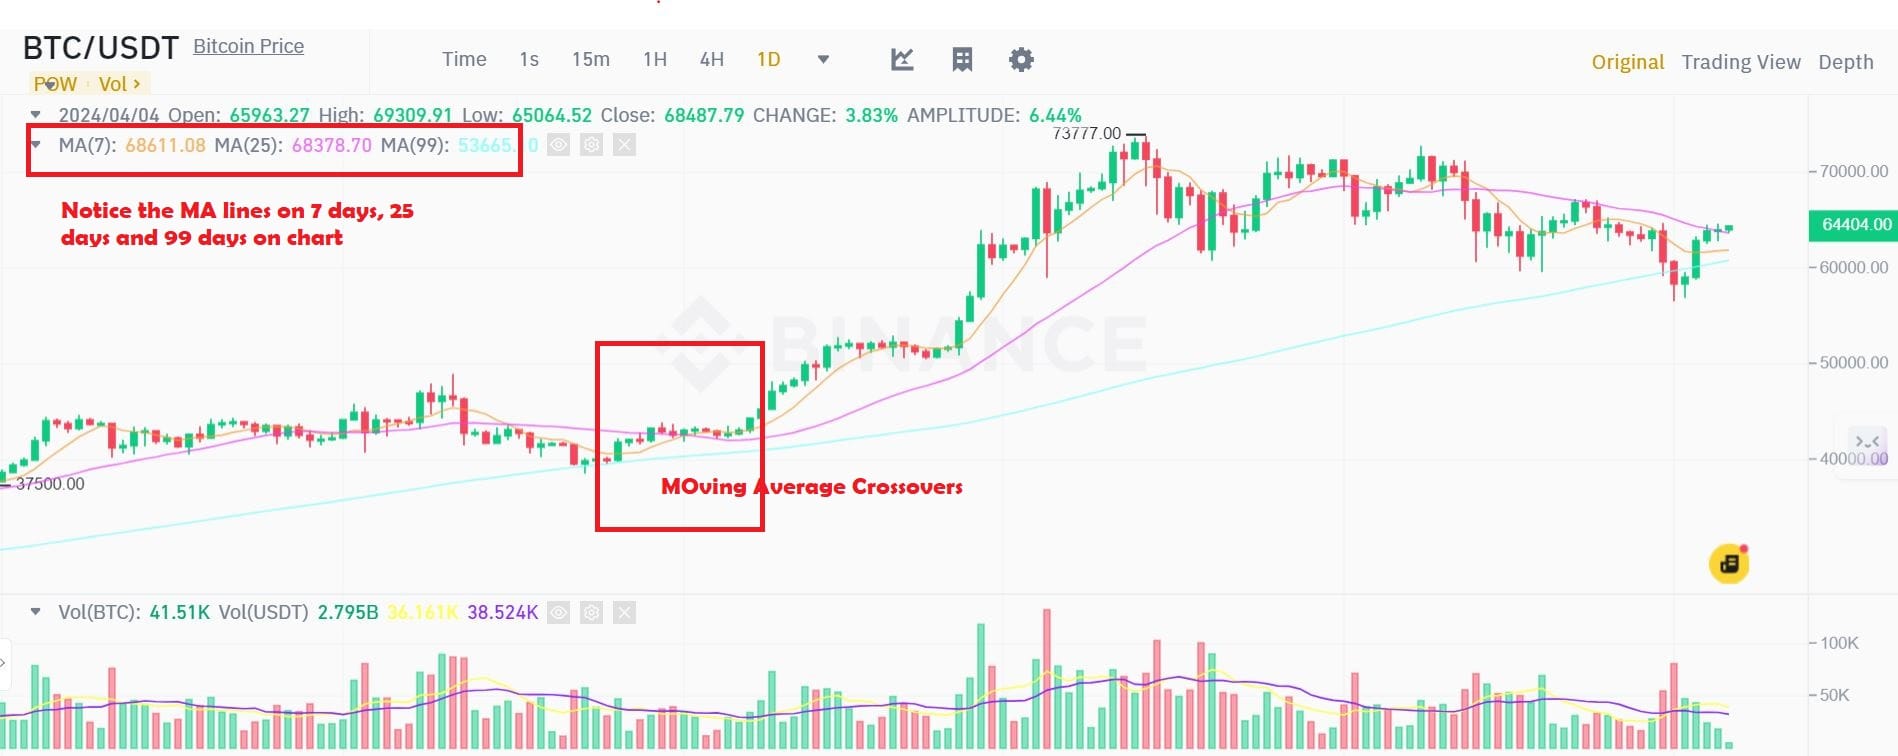
Moving Averages (MA), such as the Simple Moving Average (SMA) and Exponential Moving Average (EMA), are vital for smoothing out price data and recognizing trends in swing trading.
The Simple Moving Average calculates the average price over a specific period, evenly distributing weight to each data point. On the other hand, the Exponential Moving Average assigns greater significance to recent prices, reacting more swiftly to changes.
Swing traders commonly leverage the crossovers between short-term and long-term moving averages as potential signals for trend reversals or continuations.
A swing trader interested in identifying bullish opportunities can configure the screener to filter for stocks where the short-term moving average has recently crossed above the long-term moving average, the trader can pinpoint potential bullish trend reversals or continuations. For example, For a stock where the 50-day SMA is $55.20 & and the 200-day SMA is $54.80, The stock screener can indicate a bullish opportunity.
Additionally, swing traders often view moving averages as dynamic support or resistance levels. Utilizing a stock screener, they can filter for stocks near a specific moving average. This assists traders in identifying potential reversal or continuation points based on the interaction of the stock's price with the moving average. For example, a Stock where the Current Stock Price is $58.50 & 20-day EMA is $58.20 can also signal a bullish opportunity
2. Relative Strength Index (RSI):
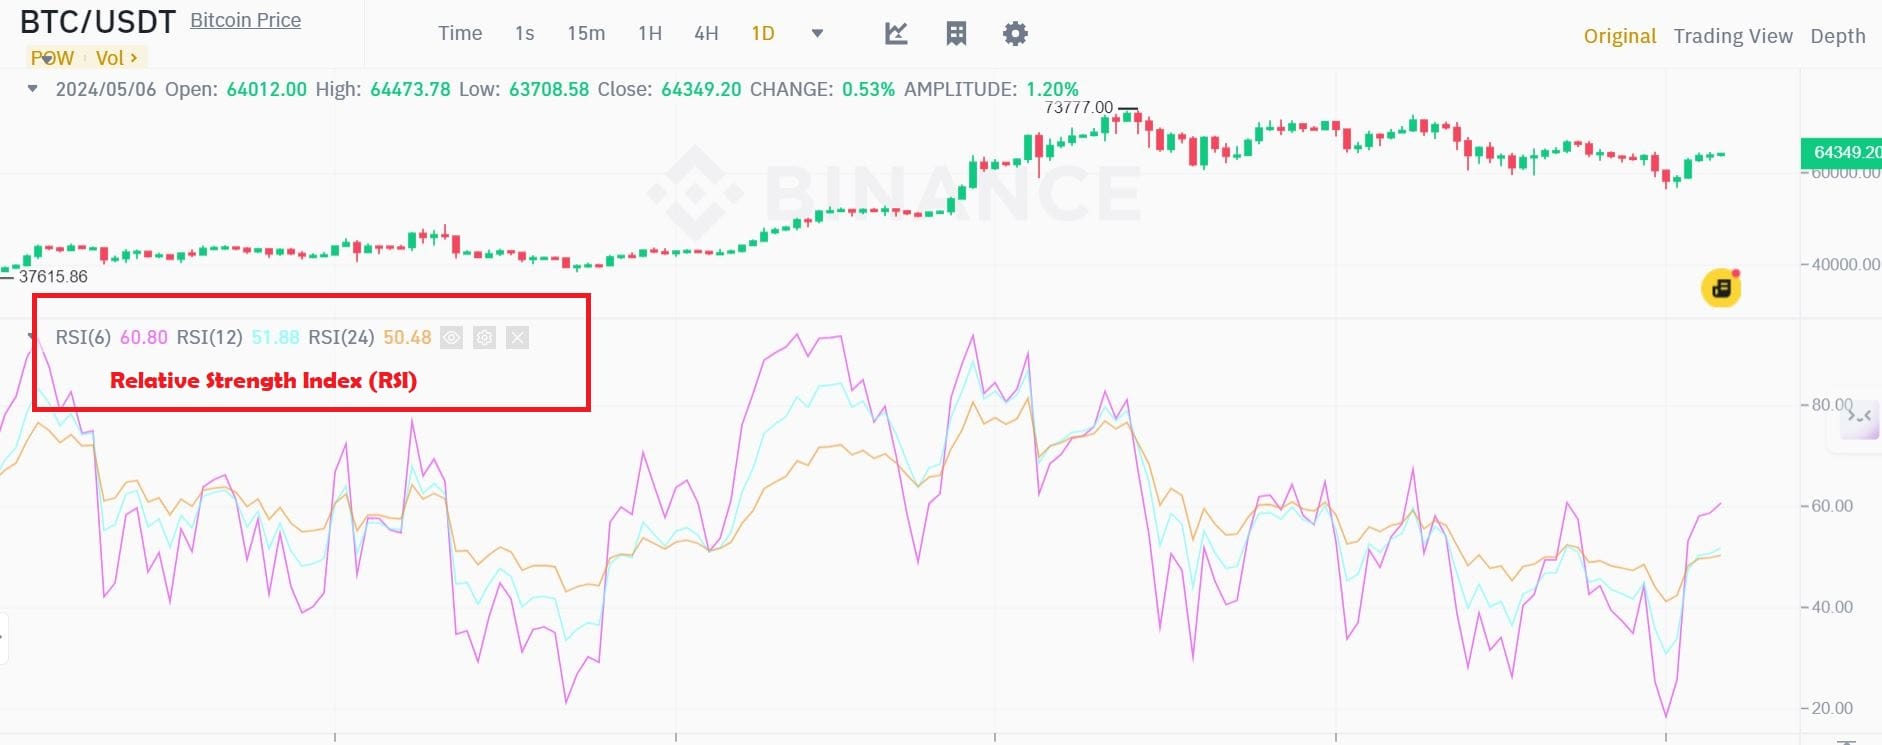
The Relative Strength Index (RSI) is another valuable metric for swing traders, offering insights into the magnitude of recent price changes and helping identify potential reversal points, particularly when the indicator reaches extreme levels.
By setting RSI thresholds, swing traders can employ the stock screener to identify stocks with RSI values falling within specific ranges.
For instance, swing traders aiming to identify potentially oversold conditions may set an RSI threshold below 30 in the stock screener. This will show the “oversold” stocks potentially presenting an opportunity for a price reversal.
Conversely, swing traders seeking potential overbought conditions can set an RSI threshold above 70 in the stock screener. By doing so, they can identify stocks where the RSI suggests that the asset may be overbought, indicating a possibility of a downward correction.
For example, a stock trading at RSI of $28.50 may suggest that the stock might be oversold, prompting the trader to investigate further for a potential opportunity in a price reversal.
Also read: Understanding Backtesting Trading Strategy for Improved Performance
3. Stochastic Oscillator:
The stochastic oscillator is a momentum indicator that helps swing traders identify potential overbought or oversold conditions in a security. It measures the closing price relative to its price range over a specific period, often 14 days. The key components of the stochastic oscillator are the %K and %D lines, representing the current closing price compared to the recent price range.
We will keep the topic of how the %K and % D lines are calculated for some time later. The point to note is ;
Overbought Conditions:
When the closing price of a stock is at or near the upper end of the recent price range, the %K and %D lines move into the overbought zone, typically above 80.
Overbought conditions suggest that the security may have experienced a significant price increase and could be due for a potential reversal or correction.
Oversold Conditions:
Conversely, when the closing price is at or near the lower end of the recent price range, the %K and %D lines move into the oversold zone, typically below 20.
Oversold conditions suggest that the security may have experienced a significant price decrease and could be due for a potential upward reversal.
Utilizing the Information:
- Swing traders configure their stock screener to systematically highlight stocks where the stochastic oscillator signals overbought or oversold conditions.
- Based on the indications, traders may consider these conditions as potential signals for entry or exit points in their swing trading strategy.
4. Moving Average Convergence Divergence (MACD):
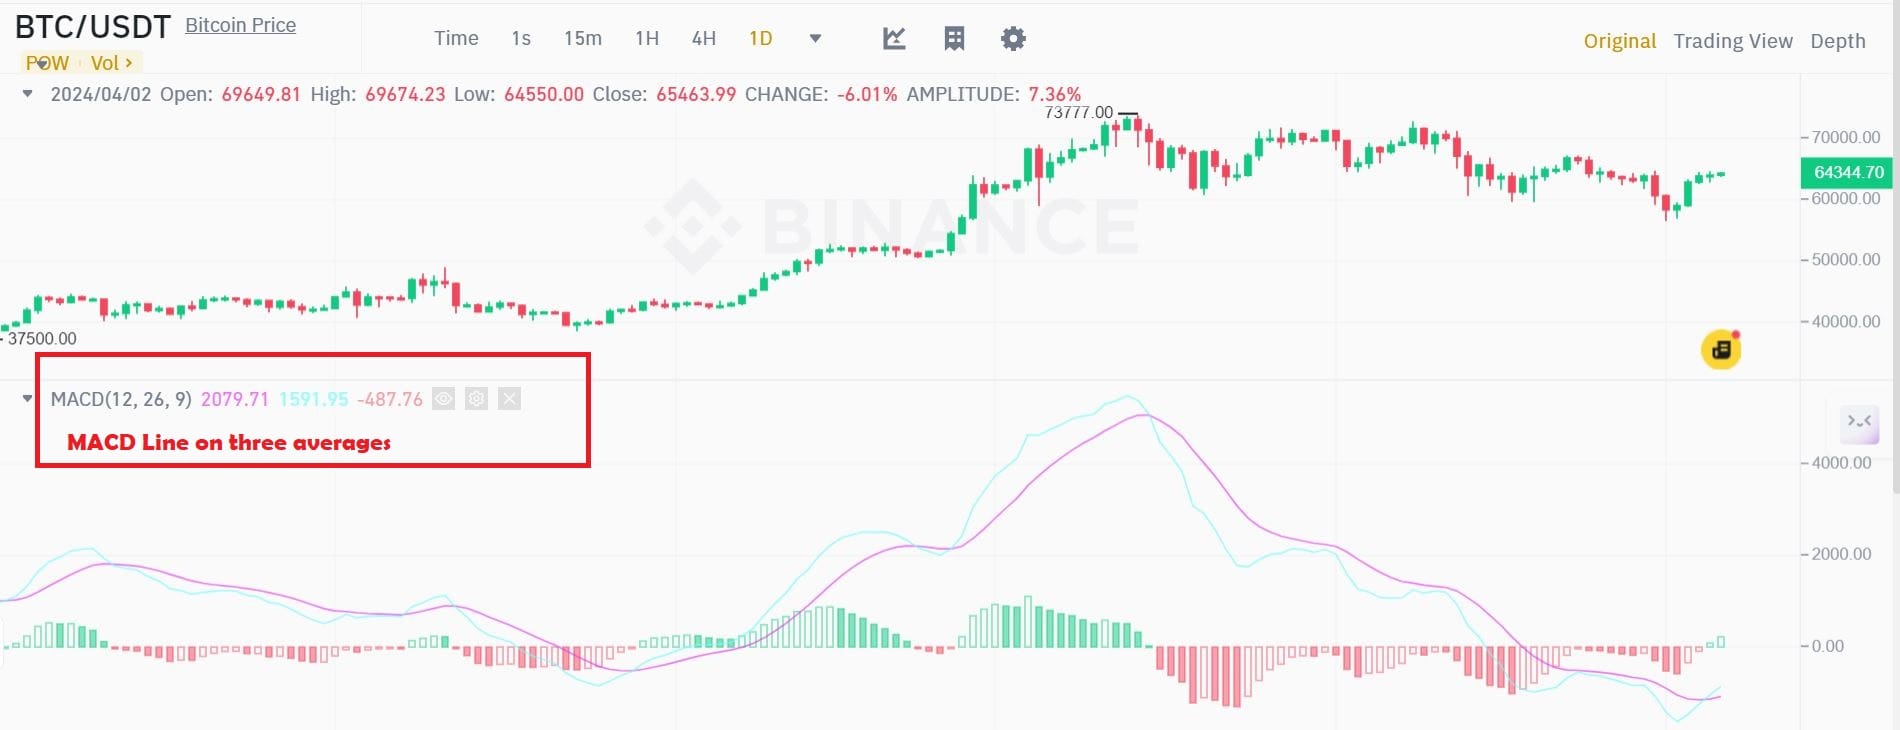
The Moving Average Convergence Divergence (MACD) serves as a crucial trend-following momentum indicator in swing trading. It illustrates the relationship between two moving averages of a security's price. Swing traders often leverage MACD crossovers and divergences to identify potential changes in trends.
MACD involves two key lines - the MACD line (fast-moving average) and the signal line (slow-moving average). Swing traders keen on spotting potential trend changes use MACD crossovers.
For example, Consider a stock where MACD Line is at $25.50 & Signal Line is at $24.80. Here, the MACD line has recently crossed above the signal line, indicating a potential bullish signal. Swing traders seeking upward trends can configure the stock screener to highlight stocks where such crossovers occur.
Conversely, swing traders looking for potential bearish opportunities might use the stock screener to identify stocks where the MACD line has recently crossed below the signal line.
For example, consider a stock where MACD Line is at $29.50 & Signal Line is at $30.00
The recent crossover below the signal line indicates a potential downward trend change, offering swing traders insights for possible short positions with ABC Corporation.
5. Bollinger Bands:
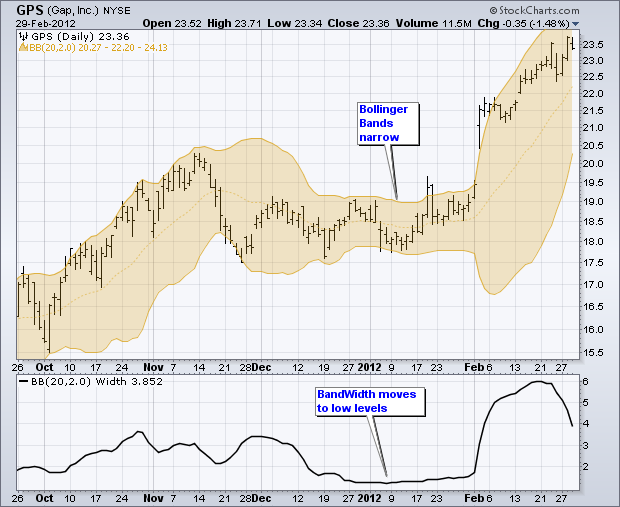
Bollinger Bands consist of three lines - the middle band, based on an N-period simple moving average (SMA), and the upper and lower bands calculated using a multiple of the standard deviation. The bands provide insights into a stock's volatility, helping traders identify potential overbought or oversold conditions and anticipate price reversals.
For example, A trader spots a stock on 1st December 2023, where the Middle Band (SMA) is $45.00, the Upper Band is $47.00, and the Lower Band is $43.00.
On 5th December, the trader observed the stock again, and this time around, the Middle Band (SMA) was at $45.50, Upper Band is at $46.00 & Lower Band is at $44.50.
At this point, the bands are relatively close together, indicating a Bollinger Band squeeze, suggesting that the stock is experiencing low volatility.
During this period of low volatility, swing traders closely monitor the stock's movements. They are particularly attentive to any expansion of the Bollinger Bands, which suggests increased volatility. Once the Bollinger Bands expand, swing traders may take action based on the breakout's or breakdown's direction. For instance:
· If the price breaks above the upper band, it may signal a potential bullish breakout.
· If the price breaks below the lower band, it may indicate a potential bearish breakdown.
Using Stock Screener for a Combination of Strategies for Swing Trading:
Not only in identifying indicators, Stock Screeners prove more helpful when we combine them with our indicators.
Utilizing more than one strategy allows traders to cross-verify signals. When signals from different strategies align, it can confirm a potential trading opportunity more precisely.
Individual strategies may generate false signals or misinterpret market conditions. Combining multiple strategies helps filter out false signals, as the likelihood of different strategies producing simultaneous false signals is lower.
Below, we will have a look at two such combinations to give you an idea of how these combos work together;
1. Trend Following with Moving Averages and Breakouts:
This strategy creates synergy by identifying stocks with a robust trend, marked by higher highs and higher lows, with a keen focus on potential breakout opportunities. A breakout from key resistance levels suggests continuing the established trend, presenting an attractive option for swing traders.
Stock Screener Application:
Stock Screener facilitates identifying assets that exhibit a consistent trend pattern and are approaching critical resistance levels. By configuring the stock screener to filter for such characteristics, swing traders gain the ability to pinpoint stocks poised for a breakout. This, in turn, provides an advantageous entry point for traders looking to align with and benefit from the prevailing trend.
Consider a Stock ABC, which has been consistently reaching higher highs and higher lows, with its price moving from $50 to $60 to $70 over the past few weeks. The Stock ABC is trading at $75 and approaching a key resistance level at $80. If it breaks above $80, it may signal a continuation of its upward trend.
With the information from the Stock Screener, you decide to enter a swing trade on Stock ABC. You buy shares at $75, anticipating that if it breaks above $80, it will continue its upward trend, providing an opportunity for profit.
2. Reversal Trading with RSI and Candlestick Patterns:
This strategy is designed to identify potential reversals by combining two key indicators.
You use the Relative Strength Index (RSI) to identify oversold conditions. When the RSI falls below 30, it suggests that the stock may be oversold, and a potential reversal could be on the horizon.
In addition to RSI, you look for bullish candlestick patterns. These patterns, such as a bullish engulfing or hammer, can indicate a potential shift in sentiment and a reversal in the stock's direction.
Based on the oversold RSI and the bullish candlestick pattern, you decide to enter a trade on the stocks filtered by your stock scanner. You anticipate a potential reversal in the stock's direction and aim to profit from the upward movement.
Critical Factors Influencing Successful Swing Trading Strategies
A Word of Caution!
Using swing trading demands understanding various factors that can significantly impact your success. Understanding these factors is equally important for successfully executing these strategies. Although the list can include several other factors, here are some of them;
- Market Conditions like Volatility can present more trading opportunities but also increase risk. Evaluate the current market volatility before initiating swing trades.
- Economic Indicators like Economic Data Releases and significant financial reports, such as employment numbers or GDP growth, can influence market sentiment and impact the success of swing trades.
- News and Events like Company Announcements, Earnings reports, product launches, or legal issues can cause significant price movements. Stay informed about relevant news related to the stocks in your portfolio.
- Sector Trends like Industry Performance and understanding the broader trends within specific sectors can affect individual stocks' performance.
- Interest Rates like Central Bank Policies, Changes in interest rates or monetary policies can influence market dynamics and impact the success of swing trades.
- Global Events like Geopolitical Events: Events such as political instability, trade tensions, or global conflicts can cause market fluctuations, affecting swing trading outcomes.
In conclusion,
Stock screeners provide a systematic means to identify and capitalize on profitable opportunities. By leveraging technical indicators, traders gain a comprehensive view of market dynamics. Furthermore, combining the technical indicators to verify the results of these technical strategies enhances the robustness of decision-making.
So,
Trade Smarter!


