Standard Deviation in Backtesting: Building Trading Strategies with Channels

"The key to making money in stocks is not to forecast the future, but to be able to evaluate the uncertainty of the future." - John Maynard Keynes
This quote by John Maynard Keynes, a famous economist and investor highlights the importance of understanding risk and volatility in the market.
Standard deviation is a key tool for traders to gauge this uncertainty and price fluctuations.
What is Standard Deviation in Trading?
In the stock market, Standard Deviation (SD) tells you how much the stock price bounces around its average price.
-When prices swing wildly up and down, SD is high, meaning the market is considered volatile.
-When prices stay pretty close to the average, SD is low, meaning the market is calm.
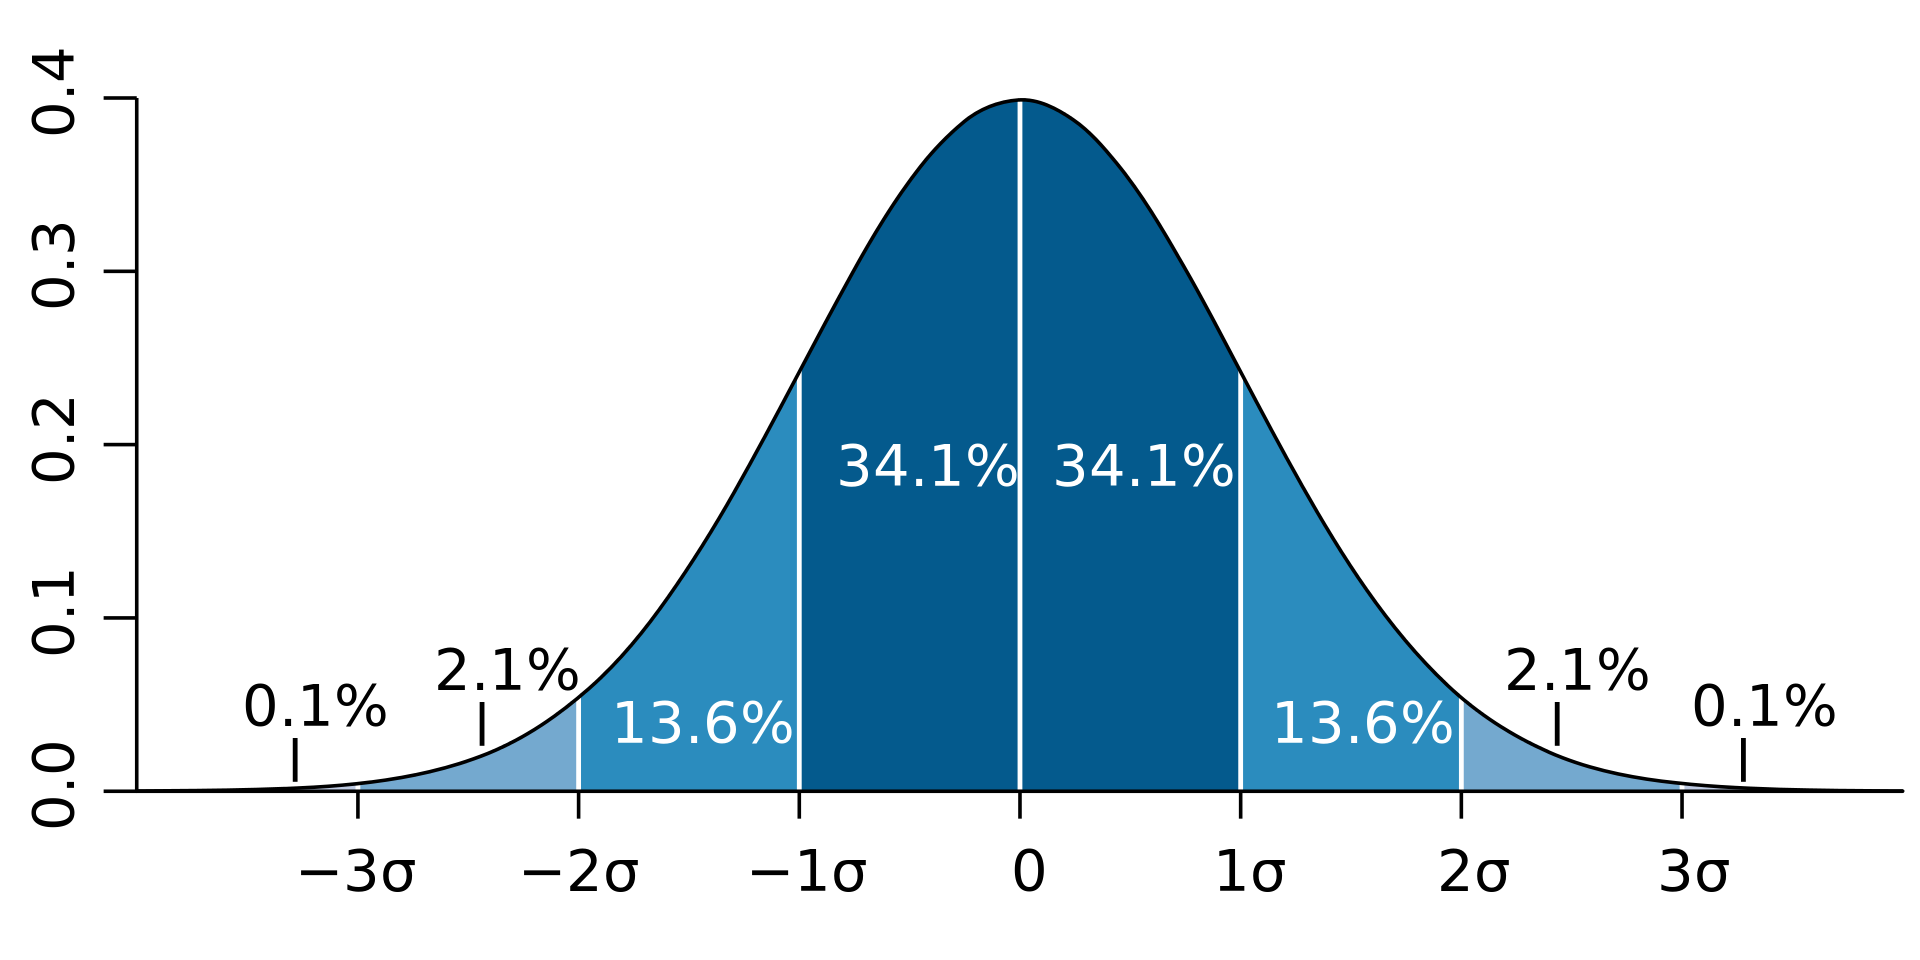
Not only does standard deviation help traders quantify certain outcomes, it also shows us that while occurrences may appear random in the short term, the more occurrences we generate, the more consistent our results become.
Thousands of occurrences typically start to create a bell curve around the median value.
This idea goes hand in hand with implied volatility (IV) in the stock market, which refers to the implied magnitude, or one standard deviation range, of potential movement away from the stock price in a year's time.
In other words, a low implied volatility environment tells us that the market is not expecting the stock price to move much away from the current stock price. This lack of implied volatility results in a range of outcomes with a narrow standard deviation of the stock near the current stock price.
A high implied volatility environment tells us that the market is expecting the stock price to move away from the current price with a greater magnitude. This high implied volatility results in a range of outcomes with a wide standard deviation away from the stock price.
How Does Standard Deviation Help in backtesting?
Backtesting lets you see how your trading strategy would have performed historically. But how do you gauge the potential risk? This is where standard deviation (SD) becomes a valuable tool.
1. SD as a Volatility Gauge
During backtesting, you calculate the SD of your strategy's returns (both profits and losses). Imagine a spread of results – some big wins, some small losses. The SD tells you how much these individual returns deviate from your average return, which is like your target.
- Low SD: If the SD is low, your trades were clustered closely around the average return. This suggests a less volatile strategy with smaller swings in results.
- High SD: Conversely, a high SD indicates your returns were spread out widely. This could mean big wins, but also potentially significant losses. This suggests a potentially riskier strategy, where your results could fluctuate more dramatically.
By understanding this, you can use SD to assess the risk-reward profile of your strategy during backtesting, helping you decide if it aligns with your risk tolerance.
2. Risk Assessment:
You already know that,
A high SD in backtesting highlights significant volatility in your strategy's returns.
While this suggests the potential for substantial profits, it also comes with the possibility of substantial losses. This increased risk might not be suitable for all investors, especially those with a lower risk tolerance.
If you choose a high-SD strategy, it's crucial to implement robust risk management techniques like stop-loss orders, position sizing limits, and portfolio diversification to mitigate potential losses during periods of high volatility.
However,
a low SD doesn't guarantee smooth sailing either.
It might just mean your strategy delivers consistent, but possibly uninspiring, returns.
Here's the key takeaway:
consider the market you're trading. A low SD strategy might be ideal in a stable market where consistent, albeit smaller, returns are preferred. Conversely, in a more volatile market, a low-SD strategy might underperform compared to one that captures larger swings.
By understanding the risk-reward profile revealed by SD in
backtesting, you can tailor your strategy to your risk tolerance and target
market.
3. Comparing Strategies:
Now this is an interesting part!
Standard deviation (SD) becomes a powerful tool when comparing multiple strategies backtested on the same data set.
Here's why:
It lets you compare apples to apples!
Let's say, you have two strategies: Strategy A with a high SD (15%) and Strategy B with a low SD (5%). Looking at these numbers in isolation might not tell you much. However, by comparing them directly, you can see that Strategy A exhibits three times the volatility of Strategy B when tested on the same historical data.
But wait there is something more to look into as well,
The Risk-Reward Spectrum
You see,
SD allows you to visualize these strategies on a risk-reward spectrum. Strategy A, with a high SD, suggests the potential for significant gains but also carries the potential for substantial losses. Strategy B, with a low SD, indicates a more consistent approach with smaller fluctuations in returns.
So,
You have to
Align Your Goals accordingly
By comparing their SDs, you can assess which strategy aligns better with your risk tolerance and investment goals. Are you comfortable with the higher potential returns (and potential losses) associated with Strategy A, or do you prioritize the lower volatility and more predictable returns of Strategy B?
By using SD effectively, you can gain valuable insights into the risk and consistency of your trading strategies, helping you choose the one that best suits your risk tolerance and investment goals.
This brings us to another important concept in standard deviation which can be very vital to your trading strategies
Standard Deviation Channels!
So,
What are Standard Deviation Channels?
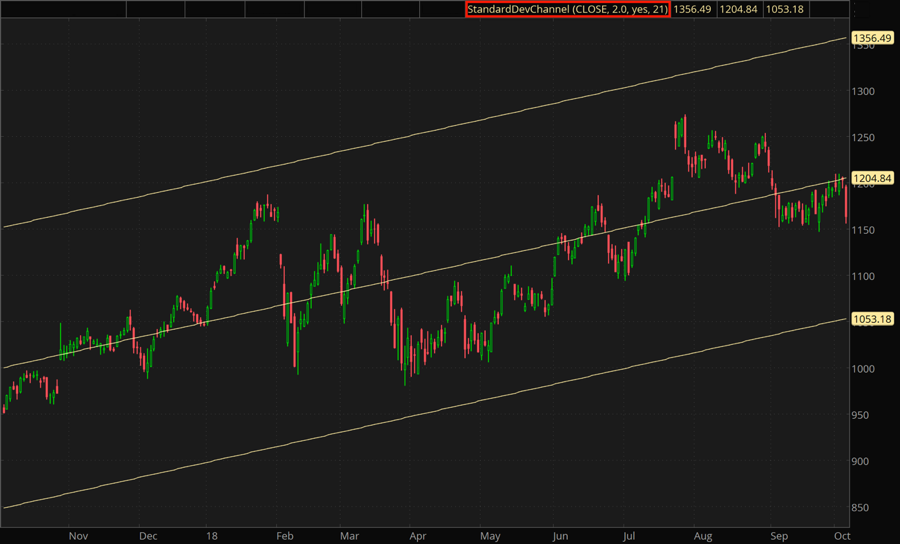
Standard deviation (SD) channels are a technical analysis overlay used on price charts to visualize potential price movements based on historical volatility.
What it means is,
Standard Deviation Channels use standard deviations around a statistically derived center line to create a channel that reflects historical price movements and potential future volatility zones.
Here's how it works on a stock price chart:
- Average Growth (Trendline): A line is drawn showing the average up and down movement of the stock price over time.
- Normal Fluctuation (Channel): Lines are drawn above and below the average line based on the standard deviation (how much the price usually goes up or down compared to the average). This creates a channel.
Why You Should Know about Standard Deviation Channels as a Trader?
Because,
It gives you opportunities to Trade!
If the price jumps way above the upper line or falls way below the lower line, that's a breakout and might signal a bigger move is coming.
Think of it like this:
The channel is like a normal "zone" the stock price tends to stay in.
The wider the channel, the more the price has typically bounced around in the past.
A breakout above the channel suggests the price might be going on a bigger upswing.
A breakout below the channel suggests the price might be in for a bigger drop.
This raises another question which is frequently asked in the trading community.
Is it possible to Backtest standard deviation channels?
Yes, it is possible to backtest your trading strategy based on standard deviation channels, but with some limitations.
Here's why.
You see,
Standard deviation channels themselves are not directly used to generate buy and sell signals. They are a volatility indicator, highlighting areas where the price might be statistically more likely to stay within a certain range based on historical standard deviation.
So, If you can define the Entry & Exit of your trading strategy, You can backtest the following strategies.
Standard deviation channel trading strategy
After defining your entry and exit rules, you can backtest the following strategies using standard deviation channels
Classic Breakout: Buy when the price decisively breaks above the upper channel and sell when it breaks below the lower channel. This strategy assumes the price will continue its move in the breakout direction.
Mean Reversion: Buy when the price dips below the lower channel (potentially oversold) and sell when it rises above the upper channel (potentially overbought). This strategy bets on the price returning towards the average price within the channel.
But,
here are some
Important Points to Consider
When backtesting your Strategy on Standard Deviation Channels
You Should add other indicators like moving averages or relative strength index (RSI) to confirm or refine your entry/exit signals based on standard deviation channels.
Test your strategy on historical data to assess its performance in terms of profitability, win rate, and drawdown. Analyze how the strategy performs during different market conditions.
The number of standard deviations used affects the channel width. A wider channel might suggest more frequent breakouts, but potentially weaker signals. Take into account this as well!
And last,
Standard deviation channels might behave differently in volatile versus stable markets. Consider adjusting your strategy accordingly.
In Conclusion
By incorporating standard deviation (SD) into your backtesting routine, you unlock a powerful tool for assessing risk and building effective trading strategies.
But Remember,
backtesting with SD channels has limitations. They don't directly generate buy/sell signals, but rather highlight areas of potential price behavior. Always define clear entry and exit rules, and consider incorporating additional indicators for confirmation. Backtest extensively under various market conditions and adjust your strategy based on the results.
By effectively using SD, you gain valuable insights into the risk and consistency of your strategies, empowering you to choose the one that aligns best with your trading goals.
Trade Smarter!


