Risk Management: Level Up with Pivot & Moving Average Stop Loss Orders

We all know that Stop Loss is an important risk management tool to safeguard from potential losses and emotional decisions. In our previous blog on different methods of Stop Loss, we discussed some types of Stop Losses like the all-or-nothing (AON) Stop Loss, ABA (ATR by ATR) Stop loss, and BBB (Bar by Bar) Stop Loss. We also discussed how to combine the ABA and BBB Stop Loss Orders to further foolproof the stop Loss Orders.
However, there are certain other methods of placing the stop loss as well.
In this Blog Post, we will discuss two more Methods to place Stop Loss Orders.
The Pivot Stop Loss orders &
Follow Moving Average Stop-Loss Orders
1) Pivot stop loss orders (Move stop every pivot in trend)
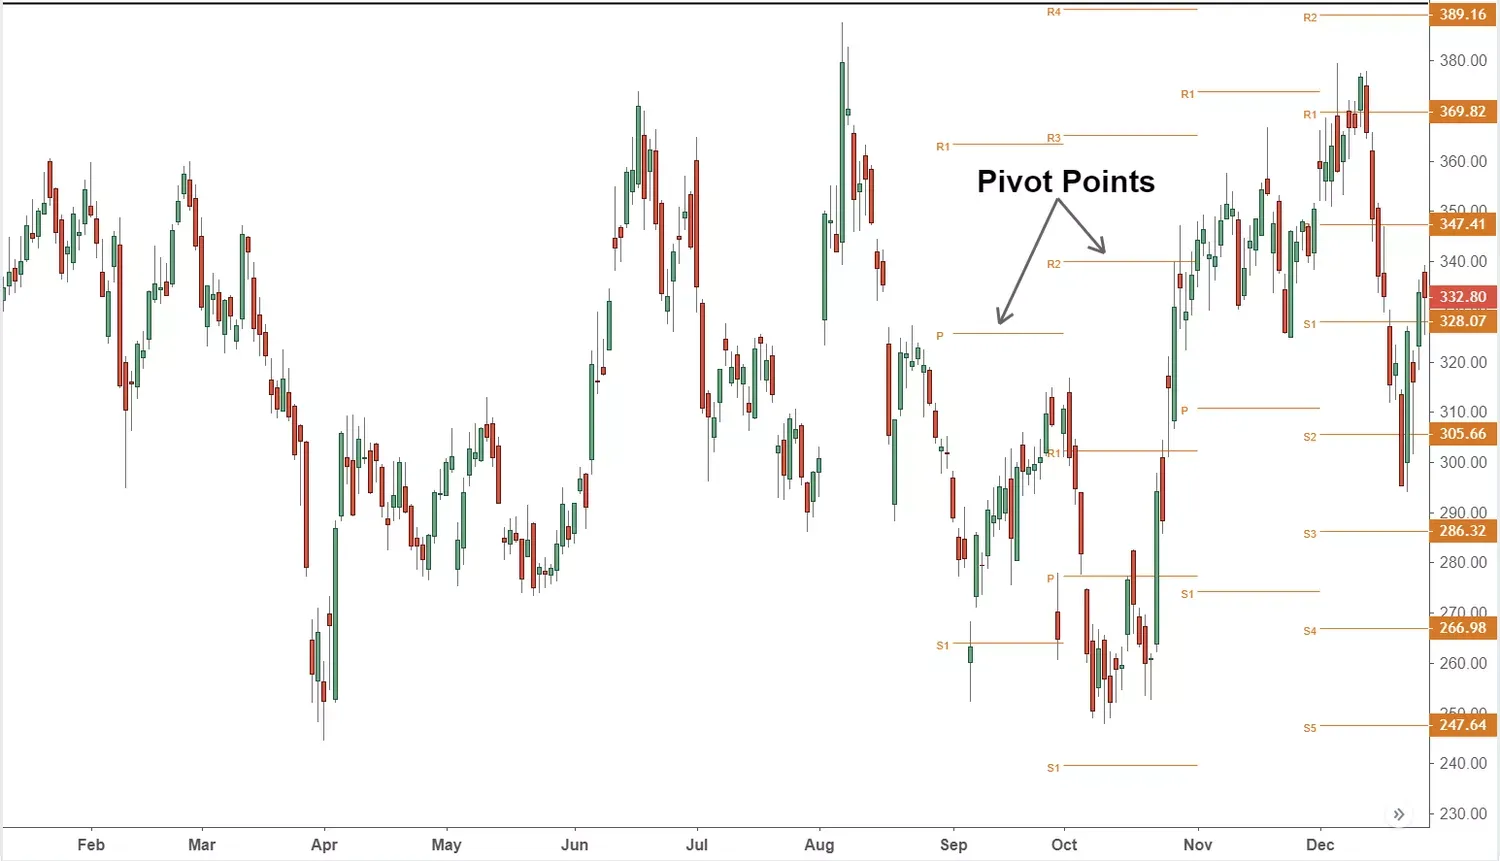
Pivot stop-loss orders, also referred to as "move stop every pivot in trend," are designed to help traders limit their potential losses by automatically selling a security when its price reaches a predetermined level known as the "pivot point."
But what exactly is Pivot Point?
Pivot points aren't directly stop-loss orders themselves, but they are a technical analysis tool used to help traders determine where to place stop-loss orders.
A pivot point is a calculated value based on the previous trading day's high, low, and closing prices for a specific asset.
Traders then use this pivot point to identify potential support and resistance levels for the current or upcoming trading session.
Support levels are areas where the price might find buying interest and bounce back up, while resistance levels are areas where the price might meet selling pressure and be pushed back down.
Here's how you can apply stop loss order using the pivot points.
Identify the Trend: You first need to establish the overall trend direction (upward or downward) using technical analysis tools like trendlines, moving averages, or other indicators.
Calculate Pivot Points: You calculate pivot points for a chosen timeframe (e.g., daily, hourly) using a specific formula that considers the previous day's high, low, and closing prices. These pivot points will generate support and resistance levels.
Initial Stop-Loss: You place an initial stop-loss order for your long or short position based on your risk tolerance and entry price. This could be a fixed distance (e.g., a certain percentage or dollar amount) below your entry price (for long positions) or above it (for short positions).
Stop-Loss Adjustments: As the price moves in your favor and breaks through pivot levels that align with the trend, you adjust your stop-loss to a level closer to the current price.
· Upward Trend (Long Position): With each upward break of a support level (identified by the pivot points), you would move your stop-loss to a new level closer to the current price, potentially just below the previous support level that was broken.
· Downward Trend (Short Position): With each downward break of a resistance level (identified by the pivot points), you would move your stop-loss to a new level closer to the current price, potentially just above the previous resistance level that was broken.
Example: Trading GBP/USD with Pivot Stop Loss Orders
Let's imagine you're considering a long position (buying) on the
GBP/USD currency pair on Monday. You decide to utilize pivot stop-loss orders
to manage your risk and potentially lock in profits.
Based on technical analysis (e.g., trendlines or moving averages), you identify an upward trend in GBP/USD.
You calculate the daily pivot points for GBP/USD. Let's assume the pivot point (P) is 1.2000, the first support level (S1) is 1.1950, and the first resistance level (R1) is 1.2050.
SO you make an entry and set Stop-Loss
You buy GBP/USD at 1.2020 on Monday.
You place an initial stop-loss order at 1.1900 (a fixed distance of 1.2% below your entry price) to manage downside risk.
Now lets see how you manage this Trade
Suppose on Tuesday, the price of GBP/USD rises and decisively breaks above the first resistance level (R1) at 1.2050. This potentially confirms the uptrend.
Based on the pivot stop-loss strategy, you would adjust your stop-loss to a new level closer to the current price, potentially just below the broken resistance level (R1) at 1.2025.
Now, this can lead to two scenarios,
Scenario 1: Continued Uptrend
In this scenario, GBP/USD continues to rise in the following days.
So, what do you do?
You might consider further stop-loss adjustments as the price breaks through subsequent resistance levels identified by the pivot points.
This allows you to lock in profits as the trend progresses while maintaining a safety net.
You eventually decide to exit the trade manually at a higher price point when the trend seems to be weakening.
But there can be another scenario to this;
Scenario 2: Price Pullback
Even with the adjusted stop-loss, there's always the possibility of a pullback in the price.
If the price falls below your adjusted stop-loss (e.g., 1.2025 in this example), your position will be automatically closed, limiting your losses.
So,
In which Market Conditions you can use the Pivot Points to Set Stop Loss?
Well,
There can be many!
For Example,
In Trending Markets where markets are exhibiting clear trends, Pivot Points can help traders identify potential reversal or continuation points. By plotting pivot levels based on previous price action, traders can anticipate key support and resistance levels where price movements may stall or reverse, allowing them to enter or exit trades more effectively.
Similarly,
In Sideways or Range-Bound Markets where price movements are confined within a specific range, Pivot Points can serve as valuable reference points for identifying potential breakout or breakdown levels. Traders can use pivot levels to gauge the boundaries of the trading range and anticipate potential breakout opportunities or reversals when the price breaks above or below these levels.
During periods of increased volatility, such as news announcements or economic events, Pivot Points can help traders navigate rapid price fluctuations and manage risk more effectively. By setting stop loss levels based on pivot points, traders can limit potential losses and protect their capital in volatile market conditions.
For intraday traders, Pivot Points can be particularly useful for identifying short-term price levels of interest and planning trading strategies accordingly. By calculating pivot levels based on the previous day's high, low, and close prices, intraday traders can pinpoint potential support and resistance levels for the current trading session and adjust their trading approach accordingly.
Traders can also use Pivot Points in conjunction with multiple time frame analysis to gain a comprehensive view of the market dynamics. By plotting pivot levels on different time frames, traders can identify confluence zones where multiple pivot levels align across different time frames, indicating stronger support or resistance levels and potential trading opportunities.
Scalpers and day traders can also benefit from the precise price levels provided by Pivot Points for executing quick trades and capitalizing on short-term price movements. By using pivot levels as entry and exit points, scalpers and day traders can make rapid trading decisions with a clear understanding of potential profit targets and risk levels.
Overall,
Pivot stop-loss orders can be a way to manage risk and lock in profits while a trend is ongoing. However, it's crucial to be aware of the limitations and potential for false signals. Here are some additional points to consider:
- Confirmation: Consider using additional technical indicators to confirm pivot point breakouts before adjusting your stop-loss.
- Partial Exits: You could explore using a combination of pivot stop-loss adjustments and partial exits to further manage risk and lock in some profits while keeping a portion of your position open for potentially larger gains.
- Automated Stops: While this strategy typically involves manual stop-loss adjustments, some trading platforms might offer options for semi-automated trailing stops based on pivot points.
2) Follow Moving Average Stop-Loss Order
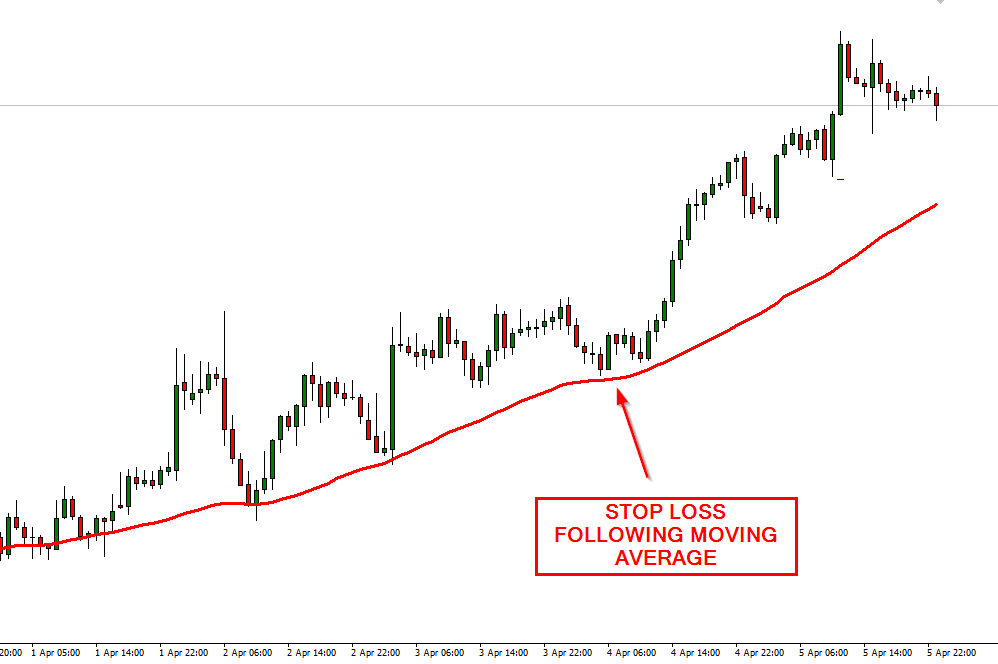
We all know about moving averages, A "Follow Moving Average Stop-Loss Order" (also referred to as a trailing stop-loss based on moving averages) is a strategy that dynamically adjusts your stop-loss level as the moving average itself moves.
Here's how it works:
You choose a specific moving average type (e.g., Simple Moving Average (SMA), Exponential Moving Average (EMA)) and timeframe (e.g., 20-day, 50-day) that aligns with your trading strategy and risk tolerance.
Next,
You set an initial stop-loss order for your long or short position at a certain distance (e.g., a fixed percentage or dollar amount) away from the chosen moving average.
· For Long Positions: The stop-loss would be placed below the moving average (e.g., 2% below the 20-day SMA).
· For Short Positions: The stop-loss would be placed above the moving average (e.g., 2% above the 20-day SMA).
Then you keep adjusting the Stop Loss
As the moving average itself moves (up for uptrends, down for downtrends), your stop-loss automatically adjusts to maintain the same chosen distance from the moving average.
In Upward Trend (Long Position), As the moving average increases, your stop-loss also moves up, potentially locking in profits as the price moves in your favor.
In Downward Trend (Short Position), As the moving average decreases, your stop-loss also moves down, potentially limiting potential losses if the price starts to rise against your short position.
This gives you certain benefits
This strategy allows your stop-loss to adapt to changing market conditions by following the moving average.
Trailing the stop-loss can also help limit potential losses if the trend reverses.
This is a relatively simple strategy to implement compared to some other dynamic stop-loss methods.
However,
There are certain drawbacks to this approach as well,
During volatile periods or short-term pullbacks, the stop-loss might get triggered prematurely, leading you to miss out on some potential gains.( We have discussed how to manage pullbacks in our blog Pullback Trading Strategies: What are they and how to use them to your advantage )
Moving averages can also sometimes lag behind price movements, which could result in late stop-loss adjustments and larger potential losses.
Overall,
Following a moving average stop-loss order can be a helpful tool for managing risk and capturing some profits while a trend is in motion. However, it's important to be aware of the limitations and potential for missed gains. Here are some additional points to consider:
- Stop-Loss Distance: The chosen percentage or dollar amount for the stop-loss distance from the moving average will impact the frequency of adjustments and the risk profile of the strategy. A larger distance provides more breathing room but might lead to missed profits, while a tighter stop-loss reduces risk but could result in more frequent exits.
- Multiple Moving Averages: Some traders use a combination of short-term and long-term moving averages to set the stop-loss distance or confirm trend direction.
- Partial Exits: You could explore using a combination of trailing stop-loss adjustments and partial exits to further manage risk and lock in some profits while keeping a portion of your position open for potentially larger gains.
Remember,
successful trading requires a well-rounded strategy.If you consider entry signals, risk management, and position sizing alongside stop-loss placement, you will be able to control your losses and
Trade smarter!


