Pullback Trading Strategies: What are they and how to use them to your advantage

Imagine, you are Sarah, a Seasoned trader, who notices one day that her carefully chosen stocks, once on an upward climb, are experiencing a sudden dip. But just as the panic threatened to rise, she reminded herself that temporary corrections happened many times, opportunities disguised as dips, and the importance of a well-defined strategy that pre-defines how to act in such cases.
Great. This isn’t a crash, its a pullback.
Armed with this new knowledge, Sarah reviewed her charts. Fibonacci retracement lines intersected at strategic points, hinting at potential support levels. The moving average, once showing an upward trend, now served as a temporary resting point. It all aligned with the blog’s teachings.
So, instead of selling in a frenzy, Sarah, like savvy investors, saw this as a buying opportunity. Carefully choosing an entry point near the support level, she placed a limit order. She also set a stop-loss order, limiting potential losses should the dip turn into a deeper plunge.
How did all of this arrangement turn out?
Sometime later, the market rebounded. Sarah’s stocks, fueled by the pullback buying, surged beyond their previous highs helping her lock in greater profits.
This Story shows you what a pullback strategy is capable of.
A pullback is one of the trading strategies that capitalize on temporary price corrections within a larger trend, allowing you to enter positions at potentially lower points and ride the wave as prices resume their upward trajectory.
In the blog post below, we will explore this strategy inside out, equipping you with the knowledge and tools to navigate the world of pullbacks like a pro.
But, before we move to the topic, here is an answer to the question that may pop up in your mind while looking at the term “Pullback”
What is the relation of AfterPullback, our trading management software name, with the Pullback Trading Strategies

Why we're called AfterPullback?
Glad that you asked
Well, it's all about a mindset. Just like in trading, where pullbacks are temporary corrections followed by renewed growth, AfterPullback embodies the spirit of resilience and bouncing back from challenges.
That's the AfterPullback philosophy. We recognize that in trading, life throws us challenges every now and then – pullbacks in our trading journeys. But instead of dwelling on the negatives, we embrace the positives. We see these challenges as opportunities to learn, adapt, and emerge stronger.
It's about developing a pullback mindset:
- Resilience: We bounce back from setbacks with determination and a positive outlook.
- Opportunity: We see challenges as chances to learn, grow, and improve.
- Strategic action: We don't just wait for the rebound; we actively strategize and take calculated risks to propel ourselves forward.
Just like a trader uses various strategies to navigate pullbacks, After Pullback offers a diverse range of tools and resources to help you thrive:
- Education: We equip you with knowledge and skills to navigate personal and professional challenges.
- Support: We provide a community of like-minded individuals who share your pullback mindset and offer encouragement through our various communication and social media channels
- Actionable steps: We offer practical resources and strategies to help you turn setbacks into springboards for success.
Learn more about our approach here - https://afterpullback.com/why
Now, back to the topic
Understanding Pullbacks
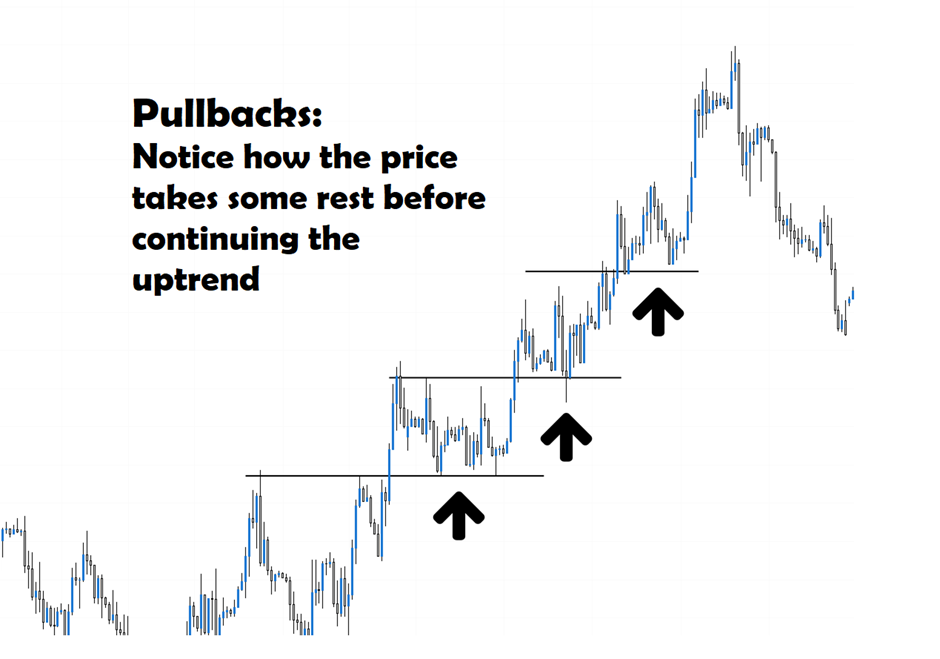
Pullbacks are the temporary dips that you see in your trading charts – brief moments of suspense before the climb upwards. These dips offer potential buying opportunities if you know how to spot them.
So, what exactly is a pullback?
Imagine an uptrend – prices steadily increasing. A pullback is a temporary reversal in the opposite direction, where prices retrace a portion of their gains before resuming the upward momentum. It’s not a crash, but a healthy correction, allowing the market to breathe before the next leg up. Understanding the motivations behind these corrections can make sense of fluctuations in assets and consumption.
But not all dips are created equal
Shallow Pullbacks retrace just a small portion of recent price movements, indicating minor profit-taking or consolidation
While,
Deep Pullbacks: retrace further, testing support levels and offering bigger potential rewards (with higher risk). Severe pullbacks, especially in highly volatile assets like cryptocurrency, can significantly impact trading strategies and investor psychology.
But you have to remember,
Not every dip signifies a pullback.
So what should you do?
Distinguishing them from trend reversals is crucial. Look for support levels, continuation patterns, and confirmation from other technical indicators to avoid entering a falling knife.
Now, why do these pullbacks happen?
Well, there can be many a reason for this slight pause before continuing the journey,
The foremost reason can be
The Profit-taking
Traders who bought earlier might lock in some profits during the pullback, creating temporary selling pressure.
Or there can be
Some technical corrections as well
Because markets rarely move in straight lines. Pullbacks represent a natural pause for price readjustment before continuing the trend.
Or,
there can also be some unexpected
News and events, which can trigger temporary retracements, offering entry points for contrarian traders.
 Imran Haider
How to Spot a Pullback Using Technical Indicators
But before we move forward, please note that these are just some of the methods to recognize the pullbacks. You may use a lot of other tools too.
1. Fibonacci Retracements:
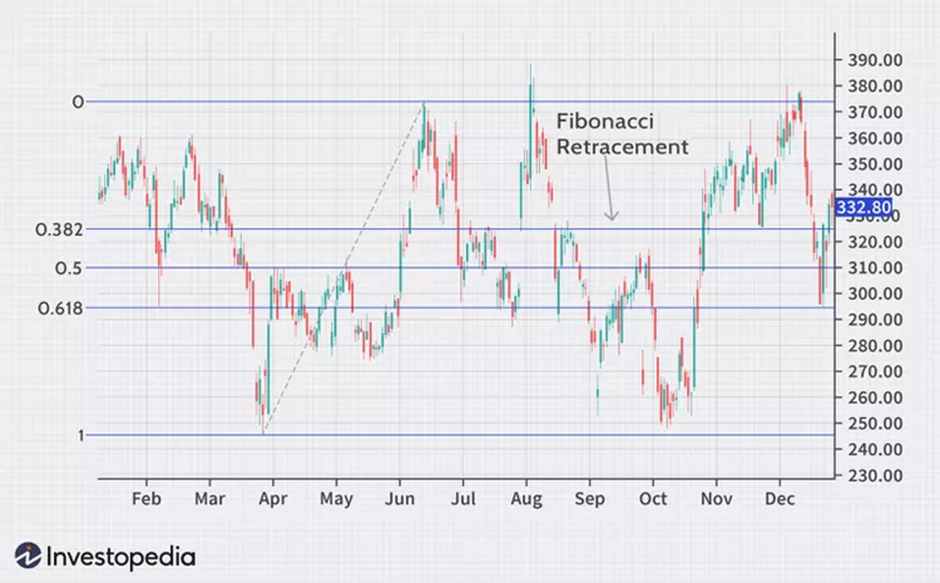
This technique leverages the Fibonacci sequence to identify potential support and resistance zones during pullbacks. The sequence's ratios (like 38.2%, 50%, and 61.8%) are believed to represent areas where price retracements often stall and reverse. By drawing Fibonacci retracement lines on your chart, you can pinpoint potential entry or exit points around these key levels.
Lets take an example,
Imagine stock A is in an uptrend, rising from $10 to $20. You draw Fibonacci retracement lines. After reaching $20, the price dips to $16.50, finding support around the 38.2% retracement level. This could be a buying opportunity based on the strategy.
2. Moving Averages:
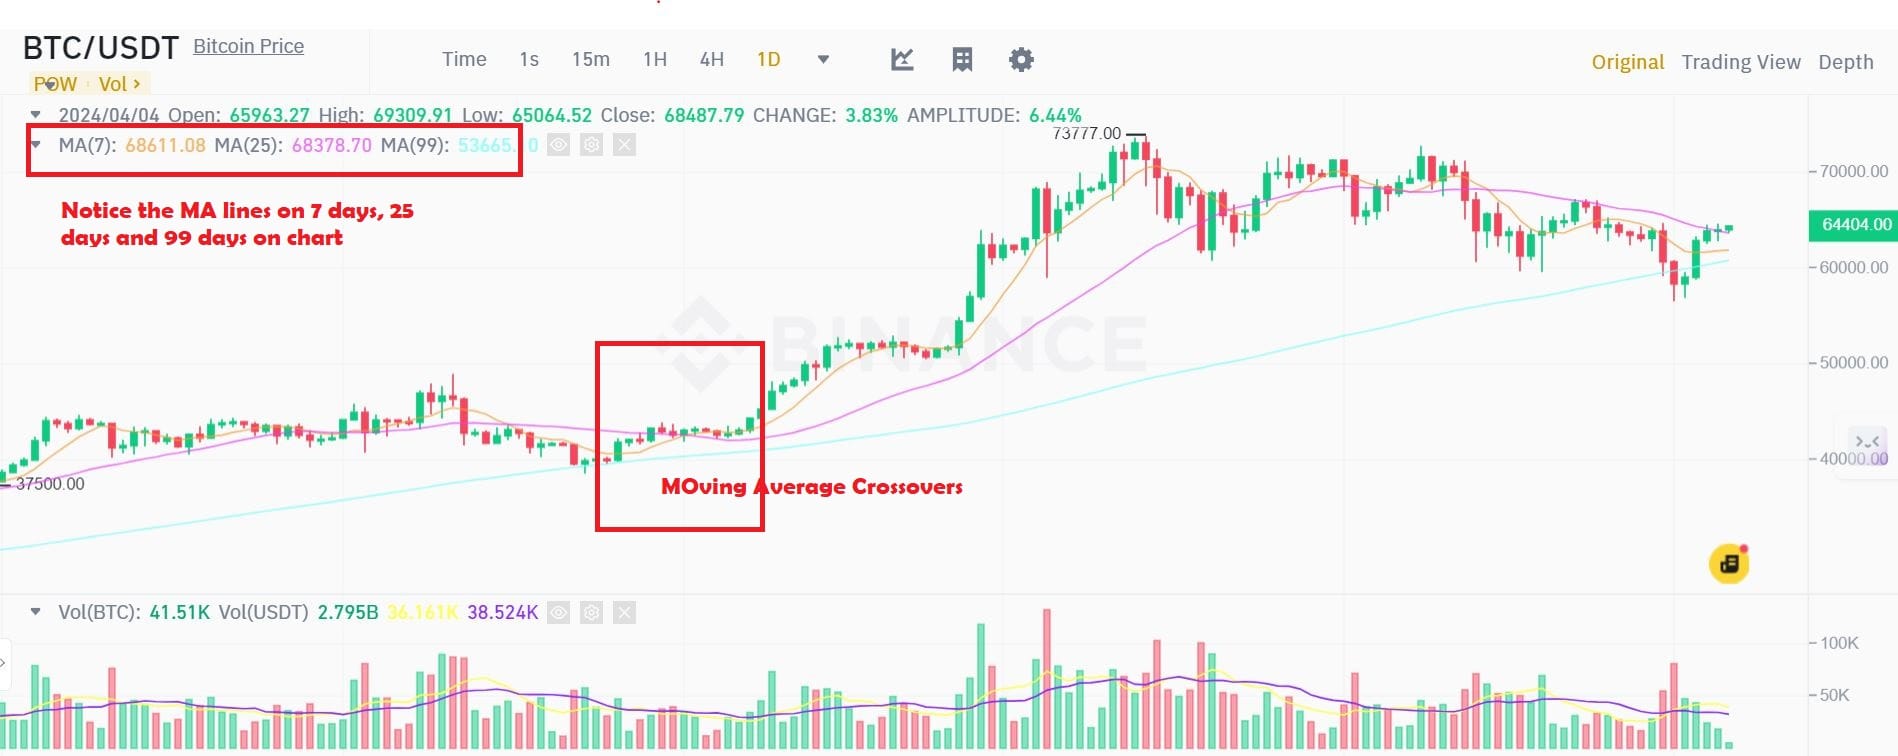
These smoothed-out lines represent the average price over a specific period. During uptrends, prices tend to stay above the moving average, and pullbacks are often seen as temporary dips touching or retracing towards the average. Strategists use moving averages to confirm trends, identify pullbacks, and set entry/exit points based on price interactions with the average line.
3. Chart Patterns:
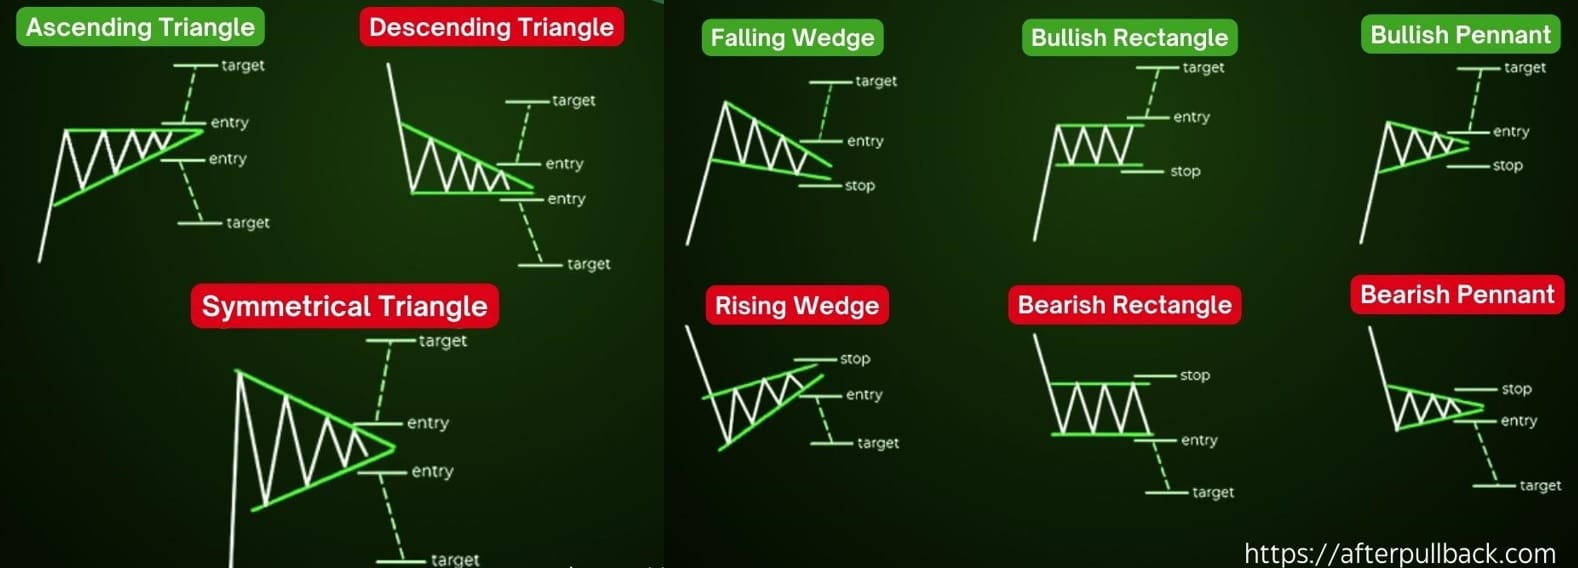
Technical analysis also relies on recognizable patterns on the price chart. Certain patterns, like flags, triangles, and double bottoms, often precede or signal pullbacks. Learning to identify these patterns equips you to anticipate pullbacks and potentially enter trades at advantageous points. We have dicussed some of these chart patterns in our blog titled 10 Common Chart Patterns That Every Trader Should Know Of.
4. Other Strategies:
While Fibonacci retracements, moving averages, and chart patterns are popular pullback strategies, there's also a whole world of additional tools to enhance your analysis:
1. Candlestick Patterns:
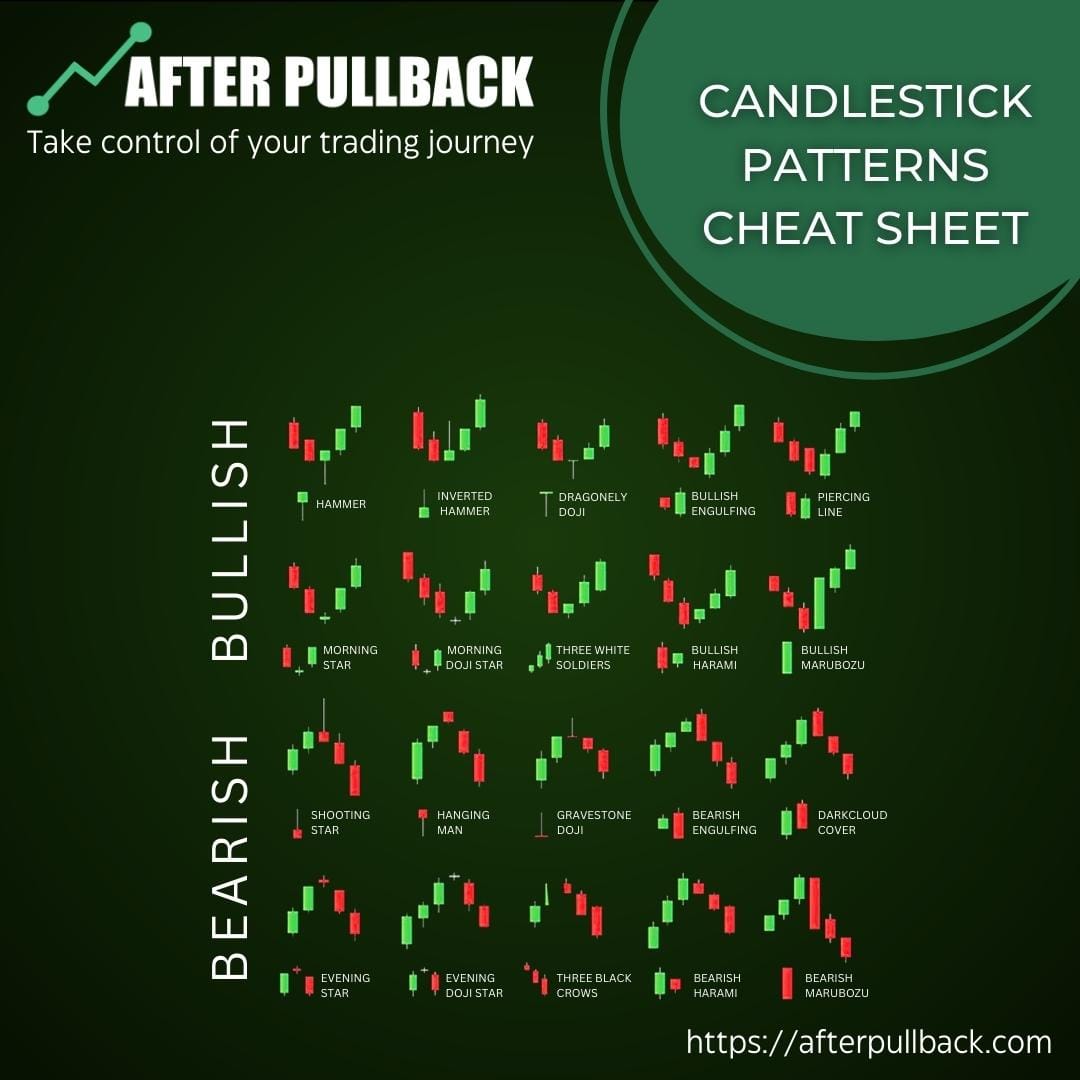
These formations offer visual clues about market sentiment during pullbacks. You can look for specific patterns like:
- Engulfing patterns: A large bullish engulfing pattern following a pullback suggests strong buying pressure and potential trend resumption.
- Hammer/Hanging Man: These candlestick formations at support levels can indicate a potential reversal after a pullback.
- Doji patterns: Indecision candlesticks like Dojis appearing during a pullback might signal a pause before the next move.
2. Volume Analysis:
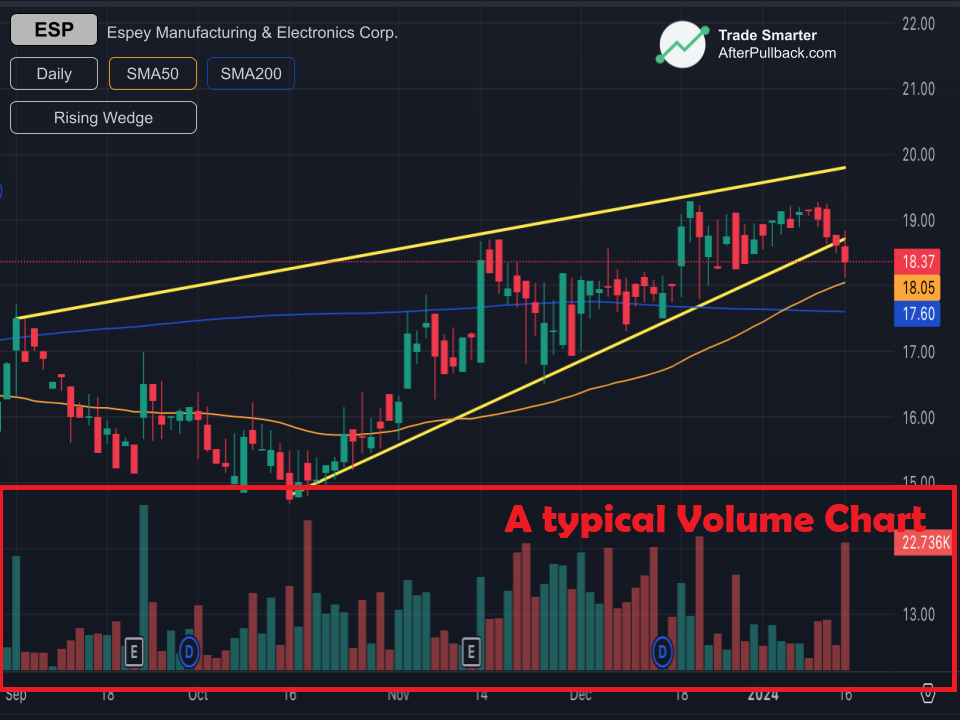
Trading volume often fluctuates during pullbacks. Observe these changes:
- Increasing volume on a pullback: This may indicate strong buying interest despite the dip, suggesting a potential reversal.
- Decreasing volume on a pullback: Can signify waning selling pressure, potentially leading to price stabilization or a bounce.
- Divergence between price and volume: When price dips but volume doesn't follow, it might hint at an upcoming trend reversal.
3. Relative Strength Index (RSI):
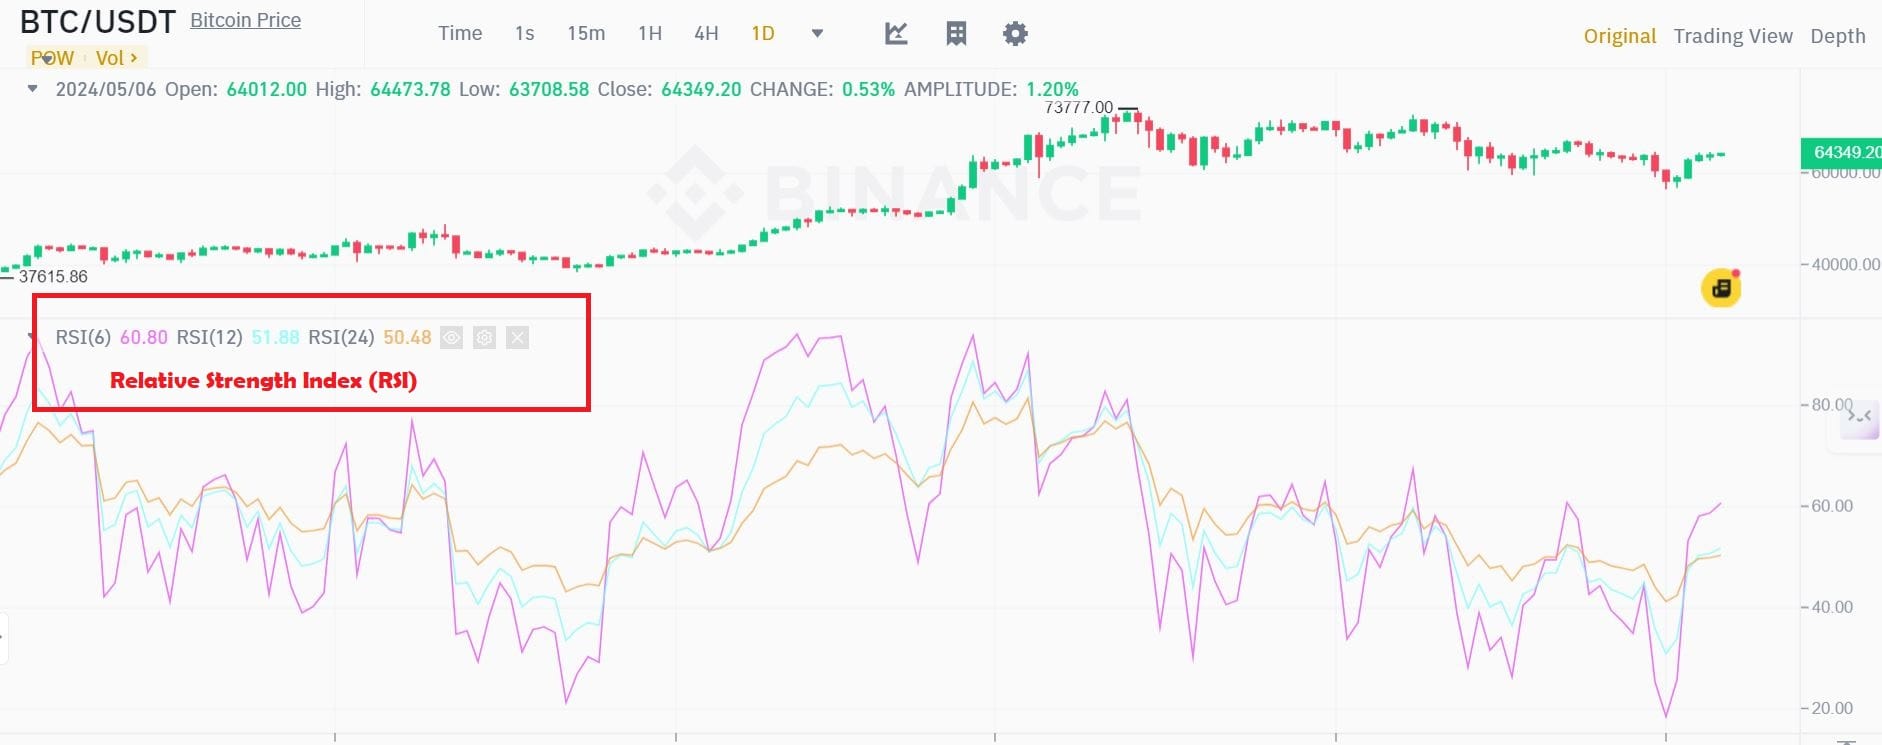
This momentum oscillator measures overbought/oversold conditions:
- Oversold RSI levels (below 30) during a pullback: Can indicate a buying opportunity if supported by other signals.
- Overbought RSI levels (above 70) during a pullback: Might suggest caution, as the pullback might continue or a reversal is less likely.
Imran Haider
Advanced Pullback Techniques and Variations
The thing to note is
That understanding the foundational pullback strategies we've discussed, like Fibonacci retracements and moving averages, is just the beginning of your pullback trading journey.
Once you've gained confidence in identifying support and resistance levels, and understanding trend confirmation signals, it's time to push your skills to the next level by exploring more advanced techniques and variations.
And there is no hurry to read these now, You can always bookmark this page and come back once you have got a grip on the basic pullback strategies.
These advanced tools can refine your entry and exit points, identify stronger potential reversals, and ultimately enhance your ability to profit from pullbacks.
Here are a few examples to ignite your curiosity
1. Beyond the Basics:
- Breakout Pullbacks: When a price breaks through a resistance level (uptrend) or support level (downtrend), a pullback sometimes follows. Identify these "retests" of the breakout level as potential entry points. If the price bounces off the breakout level and resumes its original trend, it can signal a strong continuation move.
- Double Bottoms/Tops: These chart patterns involve a price dip, a small rally, another dip to a lower (double bottom) or higher (double top) level than the first, and then a rally exceeding the initial breakout point. They signal potential trend reversals. Look for pullbacks within these patterns to confirm their strength or anticipate the reversal itself.
- Timeframe Analysis: By analyzing pullbacks across different timeframes (e.g., daily and hourly charts), you gain a wider view of market movements. Identify confluence where pullbacks appear on multiple timeframes, potentially indicating high-probability entry/exit points with stronger confirmation.
Imran Haider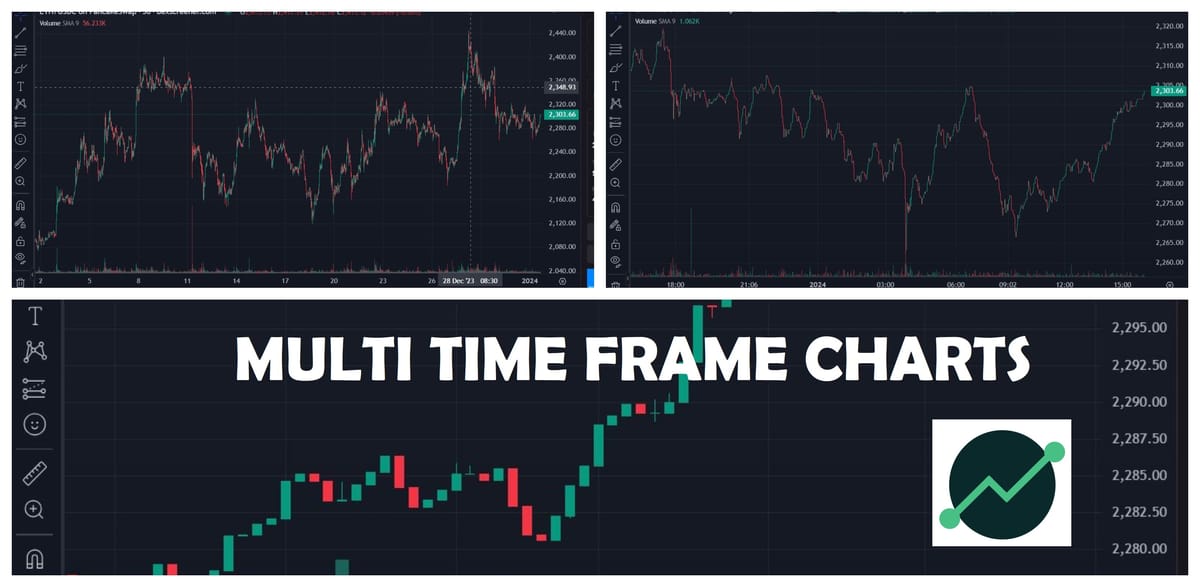
2. Synergistic Strategies:
You can also combine pullback strategies with other indicators for a more comprehensive analysis:
- Pullbacks + Moving Averages: Use moving averages to confirm the trend (price above/below) and identify pullback depths where the price might find support/resistance. Set dynamic entry/exit points based on the price interacting with the moving average (e.g., buying when the price bounces off it after a pullback).
- Pullbacks + RSI: RSI measures momentum and identifies overbought/oversold conditions. Use pullbacks near oversold levels (below 30) as potential buying opportunities, and exits near overbought levels (above 70). Remember, RSI signals can be misleading, so confirm with other indicators.
- Pullbacks + MACD: MACD uses two moving averages and a histogram to identify trend strength and potential reversals. Look for bullish/bearish crossovers within pullbacks to confirm their validity and anticipate potential trend reversals aligned with the pullback direction.
Factors to Consider When Using Pullback Trading Strategies:
Pullback trading, while potentially rewarding, isn't without its complexities. Before diving in, You need to consider these crucial factors:
Market Trends:
- Trend Strength: Only trade pullbacks within established trends (uptrend for buying, downtrend for selling). Weak trends offer less certainty and higher risk.
- Trend Clarity: Look for clear direction and consistent movement before identifying pullbacks. Avoid choppy or unclear trends.
Imran Haider
Pullback Characteristics:
- Depth: Deeper pullbacks offer potentially better risk-reward ratios, but also higher risk. Start with shallower pullbacks for practice.
- Duration: Extended pullbacks might signal a trend change, not just a temporary correction. Be cautious of overly long pullbacks.
- Volume: Increasing volume during a pullback can indicate strong buying/selling pressure, while decreasing volume might suggest waning momentum.
Technical Analysis:
- Support/Resistance Levels: Identify key support/resistance levels using tools like Fibonacci retracements, moving averages, and chart patterns. Use these for potential entry/exit points during the pullback.
- Momentum Indicators: Consider using tools like RSI or MACD to gauge overbought/oversold conditions and potential trend reversals within the pullback.
- Confirmation Signals: Don't rely solely on pullbacks. Use other indicators and chart patterns to confirm the validity of the pullback and your trading decision.
Risk Management:
- Stop-Loss Orders: Always set stop-loss orders to limit potential losses in case the pullback turns into a deeper decline.
- Position Sizing: Start small and gradually increase your position size as you gain confidence in your strategy.
- Risk-Reward Ratio: Aim for a favorable risk-reward ratio, ensuring potential profits outweigh potential losses.
- Backtesting Helps: Always backtest your pullback strategy on historical data before risking real capital.
Imran Haider
Psychology:
- Discipline: Stick to your trading plan and avoid emotional decisions based on fear or greed during pullbacks.
- Patience: Don't rush into trades. Wait for the right setup and confirmation signals before entering a pullback.
- Continuous Learning: Markets are dynamic, so keep learning, adapt your strategies, and stay updated on market trends.
Imran Haider
Conclusion
Pullbacks, like any trading strategy require practice, precision, and a touch of grace. By understanding the underlying principles, incorporating the right tools, and managing your emotions, you can transform these temporary dips into opportunities for growth.
Trade Smarter!


