Probability Cones: How to Use them for Swing and Day Trading
"Trying to analyze the price action and still not sure about the direction?"
Do you also wonder if there is another, simpler, more intuitive way to gauge risk and opportunity in swing trading?
While a perfect forecasting tool may be a fantasy, the price action Probability Cone (PC) may give you an idea of where a price might land, not with certainty, but with a little blend of math and probability!
So, what makes price action Probability Cone so intriguing?
Unlike traditional indicators that simply tell you what happened yesterday, price action Probability Cone Looks into the future, offering a visualized range of potential price movements along with their assigned probabilities.
Which means,
No more getting blindsided by sudden market swings,
but rather, preparing yourself for what could lie ahead with a calculated dose of confidence.
But why choose Probability Cone over a sea of other technical indicators?
Well, because it offers a unique advantage:
it incorporates the ever-present volatility that makes the market tick. Unlike indicators that assume smooth sailing, Probability Cone acknowledges the inherent turbulence, giving you a realistic picture of the price landscape.
So,
If you are interested in seeing how to use the probability cone to your advantage,
Dive in with us as we explore the inner workings, practical applications, and potential pitfalls of Probability Cones.
What is a Probability Cone?
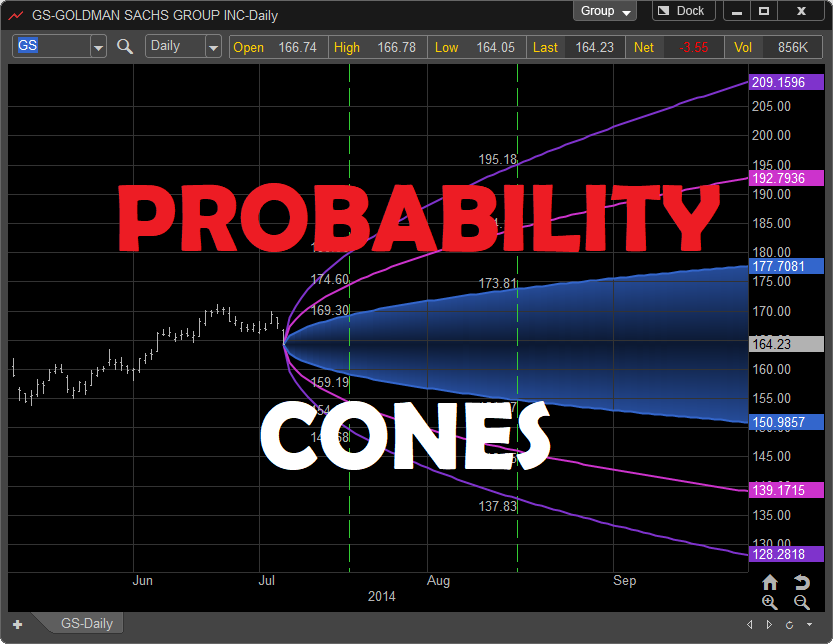
A Probability Cone is a visual tool that uses historical volatility to estimate the likely range of a stock's price within a specific timeframe. It looks like a cone or funnel, with the most likely price range at the center and less likely ranges spreading wider as you move outward.
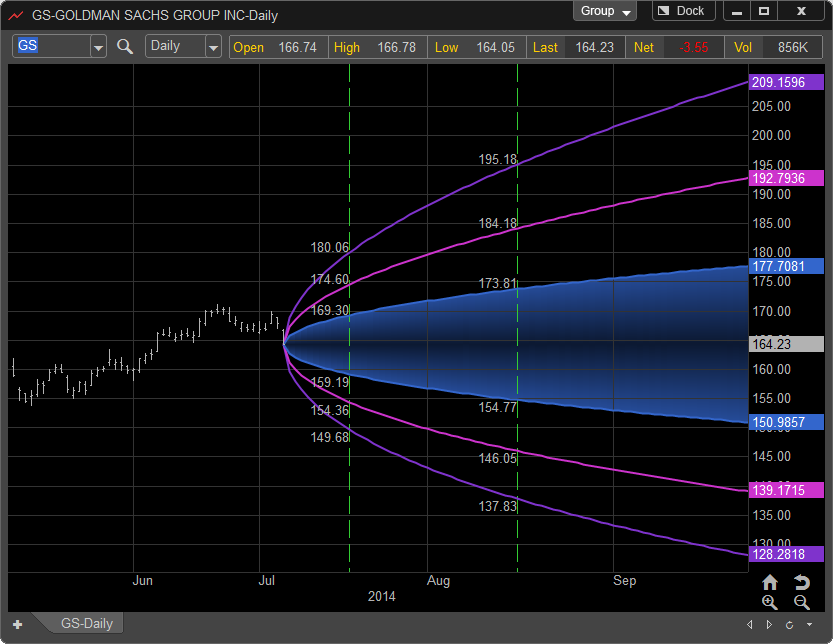
Visualizing the Probability Cone
Imagine a graph with the stock price on the y-axis and time on the x-axis. Superimposed on this graph is a funnel-shaped figure called the Probability Cone. Let's break down its key components:
1. Center Price Line:
- This is a horizontal line running through the center of the cone, representing the most likely closing price for the stock at the end of the chosen timeframe (e.g., one week). It's calculated based on the current stock price and past price movements.
2. Standard Deviation (SD) Bands:
- These are sets of parallel lines spaced above and below the center price line. Each band represents one standard deviation (SD) of historical price fluctuations.
- The first band (one SD above and below the center) encompasses approximately 68% of the expected closing prices within the timeframe. This area has the highest probability of containing the future price.
- The second band (two SDs above and below) widens the range, incorporating about 95% of the expected closing prices. It signifies a less likely, but still possible, area for the price to land.
- Additional bands can be drawn for further standard deviations, encompassing smaller probabilities (e.g., 99.7% for three SDs) but even wider price ranges.
3. Shaded Areas:
- The area within each SD band is shaded to visually represent the probability of the price closing within that range.
- The darkest shade covers the first band (68% probability), indicating the highest concentration of probable prices.
- Lighter shades extend outwards for subsequent bands, reflecting lower probabilities.
Example:
Suppose the current stock price is $100, and its historical volatility suggests an SD of $5. The Probability Cone for a one-week timeframe might look like this:
- Center Price Line: $100
- First SD Band: $95 - $105 (shaded dark, 68% probability)
- Second SD Band: $90 - $110 (shaded lighter, 95% probability)
This visualization tells you that the price is most likely to close between $95 and $105 within the week (68% chance), with a wider range possibility of $90 to $110 (95% chance). However, more extreme movements outside these bands, though less probable, are still not entirely ruled out.
Interpreting Price Movements within the Cone:
- Staying Within: This indicates continuation of the current trend or price consolidation within the expected range. Adjust your trade based on your strategy and other technical signals.
- Breaching the Cone: A breakout above the upper band might signal trend continuation, offering entry opportunities for swing traders. Conversely, a breach below the lower band could indicate trend reversal, prompting exits for swing traders and cautious observation for day traders.
- Bouncing Off the Cone: Price reversals off the bands can present trading opportunities. Look for confirmation from other indicators before entering on bounces from support (lower band) or resistance (upper band).
How probability Cones help different trading styles?
The Price Action Probability Cone (PC) can be a powerful tool for visualizing potential price movements and informed trading decisions.
Let's explore deeper into its application for different styles, interpreting price action within the cone, and using it to craft trading strategies
1. Applying Probability Cones for Position Trading (Long Term Trading)
For long term trading, probability Cones can help us
Identify Support & Resistance
How? Lets find out
the outer boundaries of the 95% bands represent areas where significant buying or selling pressure might come into play, potentially forming long-term price floors and ceilings. These zones are less likely to be breached compared to the narrower bands within the cone.
This opens up
More trading Opportunities
When prices touch the lower 95% band and bounce back, it suggests a potential buying opportunity for a long-term trade. The limited downside potential within the wider band offers confidence in a possible price reversal.
Conversely,
Approaching the upper 95% band could signal an impending resistance breakout and potential price reversal. Consider taking profits or exiting your long position before the breakout to avoid potential losses.
Even the shape of the cone can reveal some trading opportunities,
A Narrow Cone, A cone with tightly packed bands indicates low volatility. This suggests the asset might be a good candidate for buy-and-hold strategies due to its relative stability and predictable price movements.
On the other hand,
A Wide Cone, A cone with wider bands signals higher volatility and potentially larger price swings. While this can offer higher returns, it also presents greater risk. For long-term position trading, ensure thorough due diligence and a robust risk management plan before entering such volatile assets.
2. Applying Probability Cones for Swing Trading (Medium Term Strategies)
If you are a swing trader, Probability Cones can help you identify
Because of the Center and First Band (68%)
This zone represents the most likely price movements (68% probability) based on recent volatility. Use it to confirm existing short-term trends.
If the price remains within the center and first band, it suggests the current trend has momentum and might be suitable for entering a trade in line with that trend.
Conversely,
a break below this zone for downtrends or above for uptrends could signal a weakening or reversal of the trend, prompting an exit.
Similarly,
Probability Cones can help you identify
Through Wider Bands (95%)
These boundaries encompass less likely price movements (95% probability) but can act as valuable risk management tools. Place stop-loss orders just outside the 95% bands to automatically close your position if the trend unexpectedly weakens or reverses, limiting potential losses.
and in the end,
Probability Cones, help you in ,
Breakout Identification
You monitor price movements that pierce the upper or lower cone boundary. These breakouts can signal potential continuations or reversals of the current trend.
They can also provide you with
Entry Opportunities
Analyze breakouts in conjunction with other technical indicators like moving averages or oscillators. If they corroborate the breakout signal, it can offer a new entry opportunity for a swing trade aligned with the projected trend direction.
3. Applying Probability Cones for Day Trading (Short Term Strategies)
Lets see how Probability Cones can help you in two most popular day trading strategies;
1. Scalping:
When you are doing scalping, you can imagine the center line as a flexible boundary that shifts with price movements. Look for quick entry and exit opportunities using your price action scanners, within the first band (68% probability) based on price reversals or bounces off this dynamic support/resistance level.
Day trading focuses on short-term profits, so capitalize on these price fluctuations within the first band. Enter a trade when the price bounces off the center line or support zone, and exit quickly if it breaks through the first band or encounters resistance.
2. Momentum Trading:
If you want to follow momentum trading, Utilize the first band (68%) as a guide for riding short-term momentum within the current trend. Enter a trade in the direction of the trend when the price remains within this band.
Be swift with your exits!
If the price breaks out of the first band, whether upwards or downwards, it signals a potential trend reversal. Exit your position promptly to avoid losses and capture quick profits within the momentum wave.
Limitations of Probability Cones:
While the Probability Cone offers valuable insights, it's crucial to acknowledge its limitations and approach it with a healthy dose of skepticism.
Always remember,
History Doesn't necessarily always repeat!
Relying solely on historical data within the cone can lead to blind spots. Unexpected events, changing market dynamics, and unforeseen news can cause significant deviations from predicted ranges.
For trading, you also have to think
Beyond Volatility
The price action Probability Cone primarily focuses on volatility, but other factors like economic data, company fundamentals, and investor sentiment can significantly influence price movement. Don't neglect these broader contexts.
Misinterpretations & Overreliance
Misreading cone signals or blindly trusting its predictions can be disastrous. Price movements within the bands can be temporary fluctuations, not guaranteed continuations of a trend. Remember, confirmation from other indicators is crucial.
So,
How can we use the Probability Cone safely and effectively?
Combine it with other tools
To Enter a trade, Consider technical indicators like moving averages, oscillators, and volume analysis to validate Probability Cone signals and paint a clearer picture of potential price movements. The Same Volume confirmation and conditions like overbought and oversold conditions can be used to exit the trades as well
Fundamental Analysis Matters
Don't forget to research the company's financials, industry trends, and competitive landscape. Understanding the bigger picture beyond volatility is key to informed decisions.
Risk Management is King
Always set stop-loss orders and manage risk effectively, regardless of what the price action Probability Cone suggests.
Frequently Asked Questions:
1. How do you use a probability cone?
Visualize potential price ranges: Cones depict areas where future prices are most likely to land (e.g., 68% within center band).
- Gauge market sentiment: Narrow cones suggest low volatility and stable markets, while wide cones indicate higher volatility and uncertainty.
- Identify breakouts and trends: Watch for price movements breaching the cone boundaries, potentially signaling trend changes or entry/exit points.
- Manage risk: Use cone bands as guides for placing stop-loss orders to limit potential losses.
2. What is the probability theory of trading?
It analyzes market behavior through statistical models, assigning probabilities to future price movements based on historical data and volatility.
This theory doesn't predict exact prices, but helps traders understand potential price ranges and make informed decisions.
3. What is a volatility cone?
Another name for probability cones, highlighting their focus on visualizing potential price movements based on historical volatility.
4. Can probability ever be over 100%?
No, probability by definition must range from 0% to 100%. Values exceeding 100% indicate errors or misinterpretations in calculations.
5. How to use a probability cone for Swing trading?
- Confirm trends: Use the center and first band (68%) to confirm short-term trends and enter trades aligned with them.
- Set stop-loss levels: Place stops at wider bands (95%) to limit losses if the trend weakens or reverses.
- Identify breakouts: Monitor breakouts above/below the cone for potential trend continuations or reversals, offering new entry opportunities.
6. How to use a probability cone for Day trading?
- Scalping: Use the center line as dynamic support/resistance for quick in-and-out trades within the first band (68%).
- Momentum trading: Enter with the trend within the first band and exit quickly if the price breaks out or stalls.
- Combine the price action Probability Cone with other short-term indicators and market sentiment for enhanced accuracy and risk management.
7. What are the 5 key assumptions of Probability Cone?
- Market movements follow a random walk and are statistically predictable within certain limits.
- Volatility remains relatively constant over time (though in reality, it fluctuates).
- Historical data accurately reflects future price behavior (although market dynamics can shift).
- The underlying asset follows a normal distribution (which may not always hold true).
- Prices move independently within timeframes used for cone calculations (while some dependence can exist).
Trade Smarter!