Price Action Scanners: What are they and How to use them!
Some wise trader once said,
“Stock prices are not just numbers; they are a complete reflection of human emotions & market dynamics."
The Statement is so valid because ‘price’ alone is the single most crucial element in financial markets. It’s because it encapsulates a wealth of information, including supply and demand dynamics, market sentiment, and fundamental factors. Understanding price movements is vital for traders as it is the basis for making informed decisions, managing risk, and capitalizing on market opportunities.
Price action scanners understand the importance of price and, therefore, focus solely on them. These tools are designed to analyze and interpret real-time price movements, patterns, and trends. With price action scanners, traders gain insights into market dynamics, identifying potential trade opportunities, trend shifts, and reversals. This intelligent tool is like a set of eyes on the stock exchange, forex market, or whatever financial arena you’re into. A price action trading scanner helps traders identify stocks that exhibit significant price movements, such as Breakouts or Breakdowns, and understand key Support and Resistance levels within price action trading strategies.
So, let's understand first!
What is Price Action Trading?
Price action trading is a trading strategy that focuses on analyzing the price movement of a security to identify potential trading opportunities. It involves studying the price chart to understand the market’s behavior, sentiment, and trends. Price action trading is based on the idea that the price of a security reflects all the available information about the market, including fundamental and technical factors. By analyzing the price action, traders can identify patterns, trends, and levels of support and resistance, which can help them make informed trading decisions.
What is a Price Action Trading Strategy Scanner, and Why do traders swear by it?
A price action scanner is a software/tool designed to classify particular strategies or patterns in the price of financial instruments like currency pairs, stocks, cryptocurrencies, etc., as part of a price action trading strategy. It scans through historical price data or real-time market data to identify ways that traders consider significant for making trading decisions.
Why do traders and investors use an intraday stock screener for price action?
Well, the answer to the question lies in the various convenient features of Price action scanners.
The most convenient feature that you notice when you use a screener is its Efficiency, the ability to save time by automating the process of identifying potential trading opportunities. They can quickly scan through numerous assets and highlight those that meet specific criteria. With this feature, the trader can perform Real-Time Analysis, allowing traders to react promptly to emerging market conditions. This is crucial for capitalizing on time-sensitive opportunities and managing risk effectively.
Scanners identify potential trading opportunities by indicating price action, such as stocks beginning to rise and closing above the highs of previous candles, often accompanied by increased trading volume.
Another critical aspect of a price action scanner is Pattern Recognition. The scanners are designed to recognize specific price patterns or technical indicators like candlestick patterns, support and resistance levels, moving average crossovers, and more. This helps traders identify potential trend changes or reversals. All of this is made possible by the Customization feature of Price action scanners. The ability to customize the criteria for the scanner based on trader-specific trading strategies and preferences, like setting up the requirements to identify breakouts, trend reversals, etc, makes them a more than convenient tool for traders. This results in Reduced Human Error & Focus and Concentration.
When a potential trading opportunity is identified, the scanner can send Alerts and Notifications via email, SMS, or within the trading platform. This ensures that traders take advantage of potential Trading setups through Price action scanners
Some advanced scanners may also offer Backtesting and Analysis, allowing traders to assess the historical performance of their chosen criteria, providing valuable insights into the potential effectiveness of their strategy.
Also Read: Trading Strategies- All you need to know & more!
Now that you have a fair idea of the usability of these scanners, It’s an excellent time to have a look at
Understanding Price Action Trading Strategies
Price action trading strategies are based on the analysis of price charts to identify trading opportunities. There are several types of price action trading strategies, including:
- Breakout and Pullback Entries: This strategy involves identifying stocks that are breaking out of an established trading range or pulling back to a level of support. Traders use price action trading scanners to find stocks that are showing breakouts or pullbacks, and then enter trades in the direction of the breakout or pullback.
- Intraday Stock Screener: This strategy involves using an intraday stock screener to find stocks that are showing price action during the trading day. Traders use the screener to identify stocks that are moving up or down, and then analyze the price action to determine if it’s a good trading opportunity.
- Price Action Strategy: This strategy involves analyzing the price action of a stock to identify trends, patterns, and levels of support and resistance. Traders use price action trading scanners to identify stocks that are showing strong price action, and then enter trades in the direction of the trend.
- Swing Trading: This strategy involves buying and holding stocks for a short period of time, usually from a few days to a few weeks. Traders use price action trading scanners to identify stocks that are showing strong price action, and then enter trades in the direction of the trend.
By understanding these price action trading strategies, traders can develop a trading plan that helps them identify profitable trading opportunities and manage risk.
What Different Types of Scans a price action scanner can perform?
Well, a price action scanner can perform many different scans, and we can discuss a few below just to let you have some idea; it can also be used to find breakout stocks by utilizing an intraday stock screener that features a price action scanner.
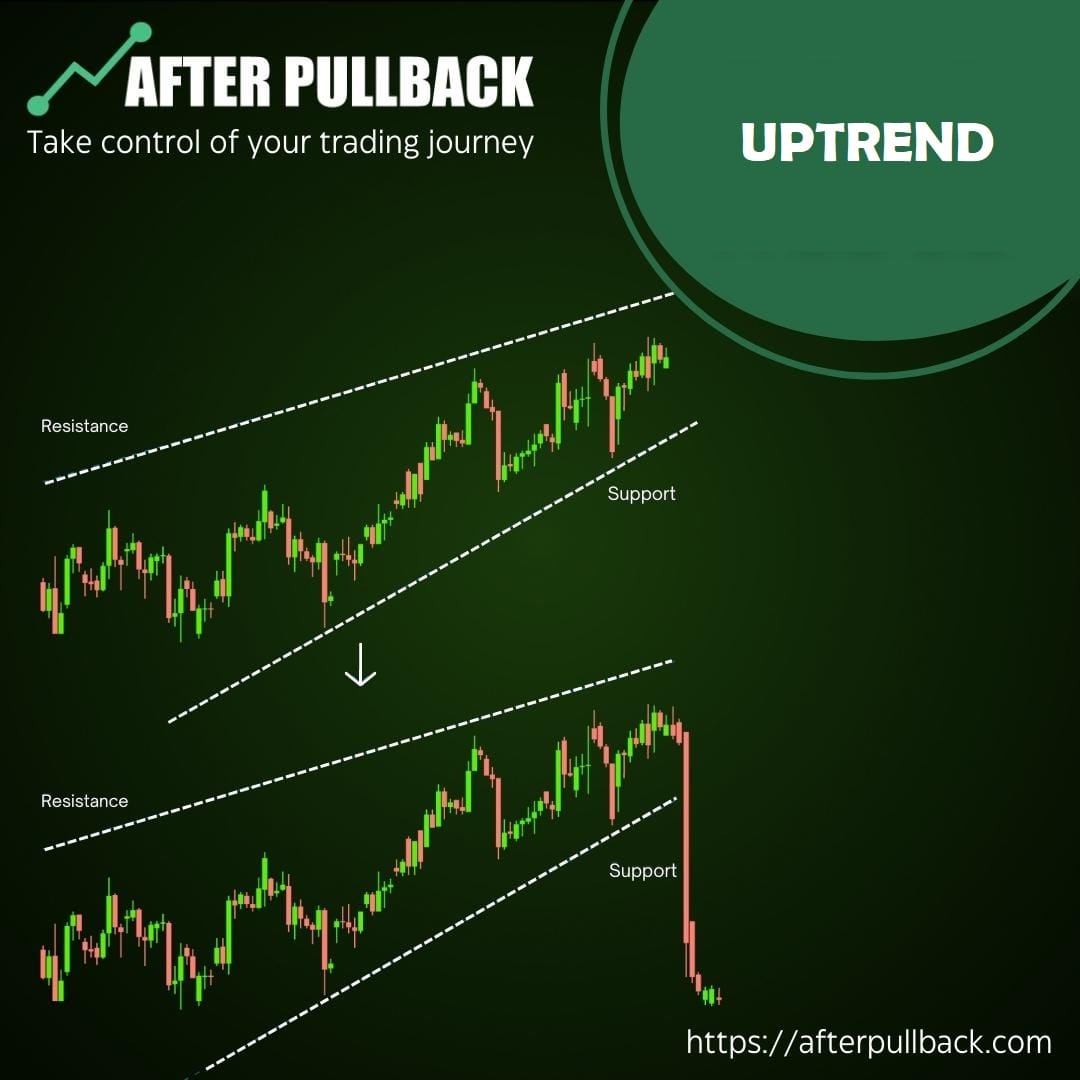
Trend Identification:
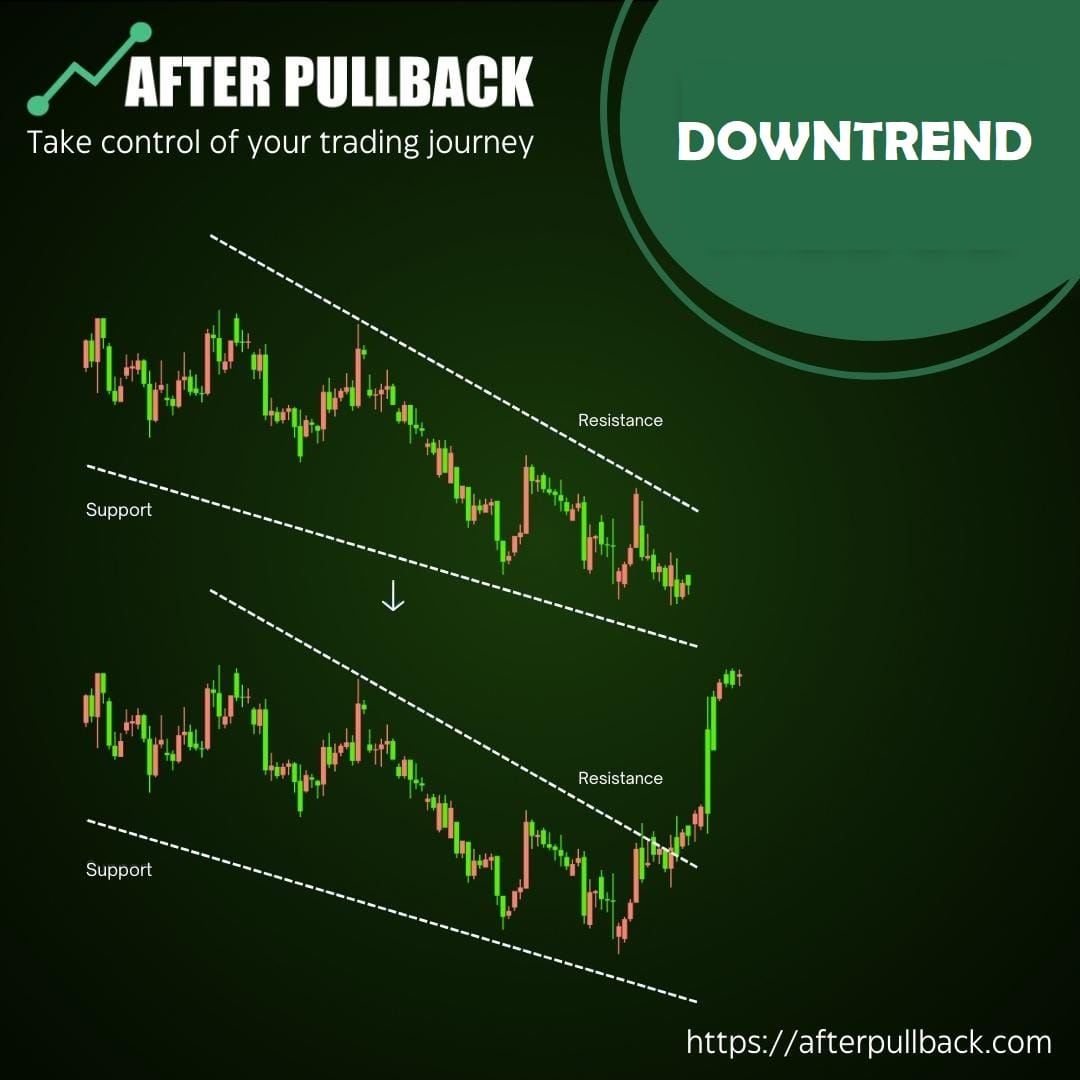
Due to their Trend Identification capabilities, price action trend scanners are indispensable for traders seeking to align their trades with the prevailing market direction. They excel at pinpointing assets that exhibit well-defined trends, e.g. it can be the formation of ‘Bull Flags’ within an uptrend, characterized by a brief consolidation before a potential upward surge, or ‘Bear Flags’ in a downtrend, marked by short-term consolidations before potential declines.
Moreover, the scanners not only look for famous characteristics, such as ‘higher highs’ and ‘higher lows’ in an uptrend, or ‘lower highs’ and ‘lower lows’ in a downtrend, but they can also detect “Gap Up” and “Gap Down” Situations very efficiently. By leveraging these trend indicators, traders position themselves to profit from calculated moves in the market.
Take the example of Amazon; in 2020, Amazon.com Inc. (AMZN) demonstrated a transparent uptrend, making higher highs and lows. Price action scanners identified Amazon’s consistent upward movement, and traders noted the well-defined trend. They used moving averages to confirm the trend direction further. The scanner flagged a potential entry point after a minor pullback to a support level. Traders entered long positions as Amazon’s stock price bounced off the support level and showed upward momentum, around $2,400 per share. Amazon continued its upward trajectory, reaching new highs of over $3,500 per share. Traders who followed this trend-following strategy profited from the ongoing uptrend.
Price action scanners identify assets exhibiting strong, well-defined trends. They incorporate moving averages for confirmation and potential entry points.
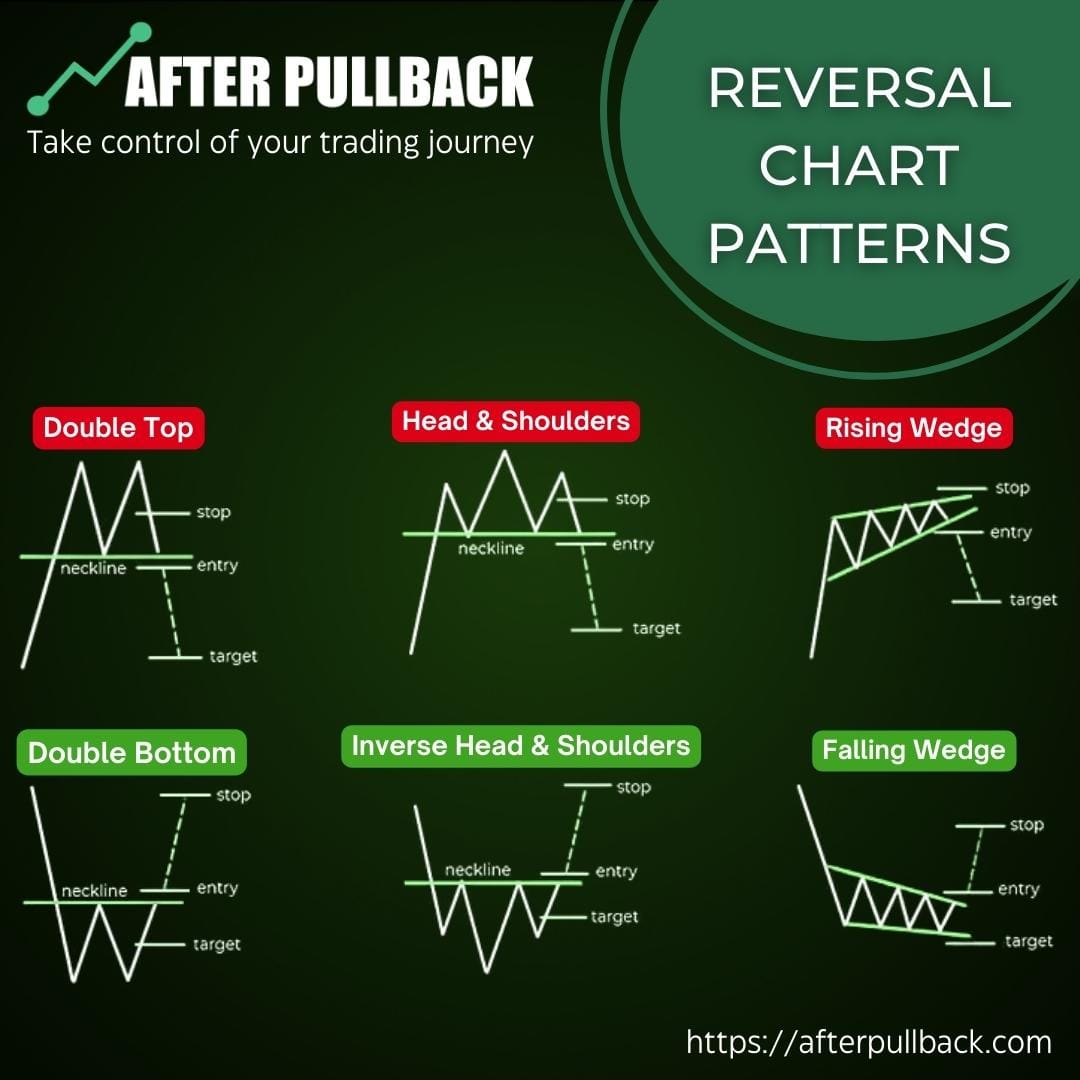
2.Reversal Patterns:
A reversal pattern occurs in trading when there is a significant shift in the prevailing market trend. These patterns typically indicate that the current trend, whether bullish (upward) or bearish (downward), is losing momentum or coming to an end. Reversal patterns suggest a potential change in an asset’s price movement, which can present trading opportunities for those who recognize and act on them. Identifying reversal patterns can also help traders spot a good potential breakout stock, especially when confirmed by a price action scanner and increased trading volume.
3. Support and Resistance Levels:
These scans identify price levels at which an asset finds buying (support) or selling (resistance) interest. The scanner looks for price action near historical support and resistance levels. Support and resistance scans are essential for traders anticipating potential price bounces or breakouts. Recognizing these levels can help identify such stocks that begin to rise and surpass the highs of previous candles, accompanied by increased volume, suggesting significant price action is occurring.

4. Volume Analysis:
The Price action scanners can also be programmed to identify patterns or conditions related to trading volume. Scans may look for stocks with unusually high volume, indicating a surge in interest and potential price movement.
For example, Suppose the price action scanner detects a price breakout or reversal, and a rise in volume accompanies it. In that case, this can indicate that the price movement is supported by a broad market consensus, making it a more reliable signal for traders. Volume analysis can confirm breakout stocks by showing increased trading activity, which supports the breakout signal. These High Probability Signals can greatly improve your trading results
Conversely, if a price action scanner spots a new high in an asset’s price but observes that the volume remains relatively low or decreases, it could signal a weakening trend and a potential false breakout.
5. Moving Average Crossovers:
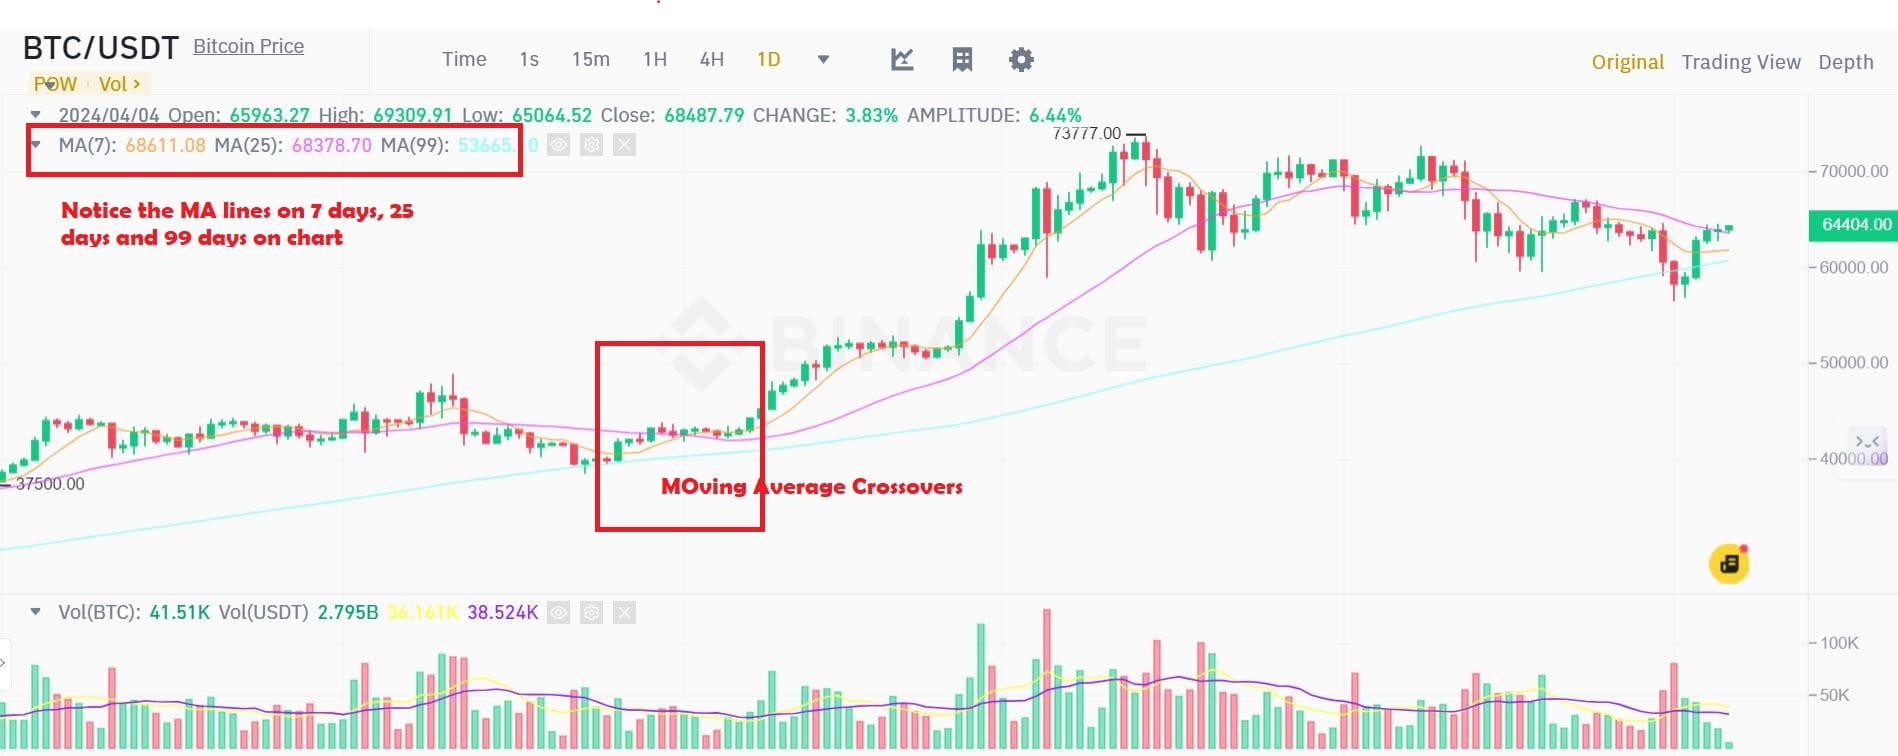
Moving average crossovers are used by traders to confirm trend changes and potential entry or exit points. These scans identify points where different moving averages intersect, indicating a potential change in trend direction. A popular crossover scan is when a short-term moving average crosses above a long-term moving average (golden cross) or vice versa (death cross). Moving average crossovers can also be effectively used in intraday trading strategies to identify suitable stocks and monitor price movements and volumes during short-term transactions.
Breakout and Pullback Entries Scans:
These scans identify assets that have moved beyond predefined support or resistance levels. Breakout scans can help traders spot potential opportunities arising from significant price movements, effectively helping them trade stocks.
Take the example of what happened with Tesla Inc. (TSLA) in 2020?
Well, in 2020, they experienced a considerable breakout, catching traders’ attention worldwide. Traders utilizing price action scanners identified Tesla’s upward movement and bullish solid momentum. The scanner flagged Tesla as it broke out of a long-standing resistance level at $400 per share. Volume spiked considerably, confirming the breakout. Traders who acted on this breakout entered long positions after the breakout was confirmed, around $405 per share. Its stock price surged, reaching a high of over $2,000 per share within a few months. Traders who capitalized on this breakout realized substantial profits.
In addition to these scans, Price action scanners can do Volatility Scans and momentum Analysis among others, which offer unique perspectives on the price of an asset and can warrant some profitable trading opportunities.
What are the Risks Associated with Price Action scanners?
Do you know that around $5 trillion were lost as the dot-com bubble burst in early 2000?
One historical example of over reliance on price action scanners, occurred during the Dot-com bubble in the late 1990s and early 2000s when many technology stocks experienced an unprecedented and unsustainable price surge, driven by speculative trading and excessive optimism about the potential of internet-related businesses.
During this period, price action indicators, such as moving averages or relative strength indicators (RSI), often gave buy signals as stocks climbed higher. Traders relying solely on these indicators would have interpreted them as opportunities to enter the market and capture further gains.
However, what followed was a dramatic market crash. In 2000, the dot-com bubble burst, leading to a significant decline in the stock prices of many technology companies. Those who had relied solely on price action signals and ignored the broader economic and market fundamentals suffered substantial losses.
So, in essence, using a price action scanner can offer several benefits, but there are also risks and considerations to be aware of:
These risks may include;
- False Signals: Price action scanners are not infallible and may generate false signals. Traders may act on these signals, leading to potential losses. It's crucial to use other forms of analysis and confirmatory tools to reduce the risk of false alerts.
- Overreliance: Relying solely on a price action scanner without considering other factors, such as market fundamentals or news events, can be risky. Traders must maintain a holistic approach to decision-making to avoid being blindsided by unexpected market developments.
- Market Conditions: Scanners may perform differently in various market conditions. They might work well in trending markets but struggle in choppy or sideways markets. Traders should understand the scanner's limitations and adjust their strategies accordingly.
- Technical Issues: Technical glitches or issues with the price action scanner's data feed can lead to inaccurate signals or missed opportunities. Traders should ensure the reliability of their scanners and have contingency plans in place.
- Strategy Fit: Not all price action scanners suit every trading strategy. Traders should carefully choose a scanner that aligns with their specific trading style and goals.
- Lack of Human Judgment: Price action scanners are based on algorithms and predefined criteria. They need to gain the human judgment and intuition that experienced traders possess. Traders need to exercise their judgment when interpreting scanner signals.
How to Overcome the Risks of Price Action Scanners:
To cover these risks, One must use the price action data to set stop-loss and take-profit levels based on support and resistance levels. Traders must avoid risking more than a predefined percentage of their capital on any trade. Traders should not solely rely on scanners. It's crucial to verify signals through additional analysis to confirm the validity of a potential trade opportunity. Failing to adjust scanning criteria to changing market conditions can lead to false signals. It's essential to adapt strategies to different phases of the market.
Final verdict
In conclusion, incorporating price action scanners into your trading strategy can significantly enhance efficiency and help identify high-probability trade opportunities. However, remember that no tool or strategy guarantees success. Continuous learning, adapting to market conditions, and practicing sound risk management are critical to long-term success in trading.
In conclusion, incorporating price action scanners into your trading strategy can significantly enhance efficiency and help identify high-probability trades. AfterPullback's Market Scanner - can help you detect those valuable opportunities while taking into consideration backtesting it to ensure proper risk management and higher probabilities.
Happy Trading


