Navigate Volatility with Intraday Price Action Scanners

Do you know what Warren Buffet says about Volatility?
"Volatility is not your enemy, it is your friend. It is the opportunity that makes good stocks cheap."
A fascinating idea indeed. Buying good stocks cheap. Isn't it ?
But,
If its that simple, why don’t every trader copy the same approach?
To get to the answer of this question, Let's consider an example of a day trader and explore how volatility affects their daily trades:
Morning Trade:
Lets suppose that the day trader starts the morning by analyzing the market and identifies a promising stock with a bullish trend. They enter a long position (buy) with the expectation that the stock will continue to rise throughout the day.
Midday Trade:
Suddenly, a news report is released indicating economic uncertainty, causing market sentiment to shift. Volatility spikes, leading to rapid price fluctuations across the market.
The stock the trader bought earlier experiences a sharp downturn, erasing potential gains. The trader decides to cut losses and exits the position, selling the stock at a lower price than they bought it.
Afternoon Trade:
Despite the earlier setback, the trader remains vigilant and identifies a new opportunity. Now, in a different stock. They enter a short position (sell) this time, anticipating a downward trend from the midday trade due to increased market volatility.
However, unexpected positive earnings results from a key company cause a sudden rally in the broader market. Volatility surges again as prices rapidly climb, and the trader's short position starts to incur losses.
Faced with mounting risks, the trader exits the trade to limit further losses.
See,
This is how volatility affects the traders.
 Imran Haider
Strategies used to Tackle volatility
Below, We will explain in detail how the two most common Strategies be used to manage volatility.
1) Leveraging Breakouts for Volatility Management
2) Managing Volatility with Bollinger Band Squeezes and High Liquidity
Lets discuss each in detail;
1) Leveraging Breakouts for Volatility Management
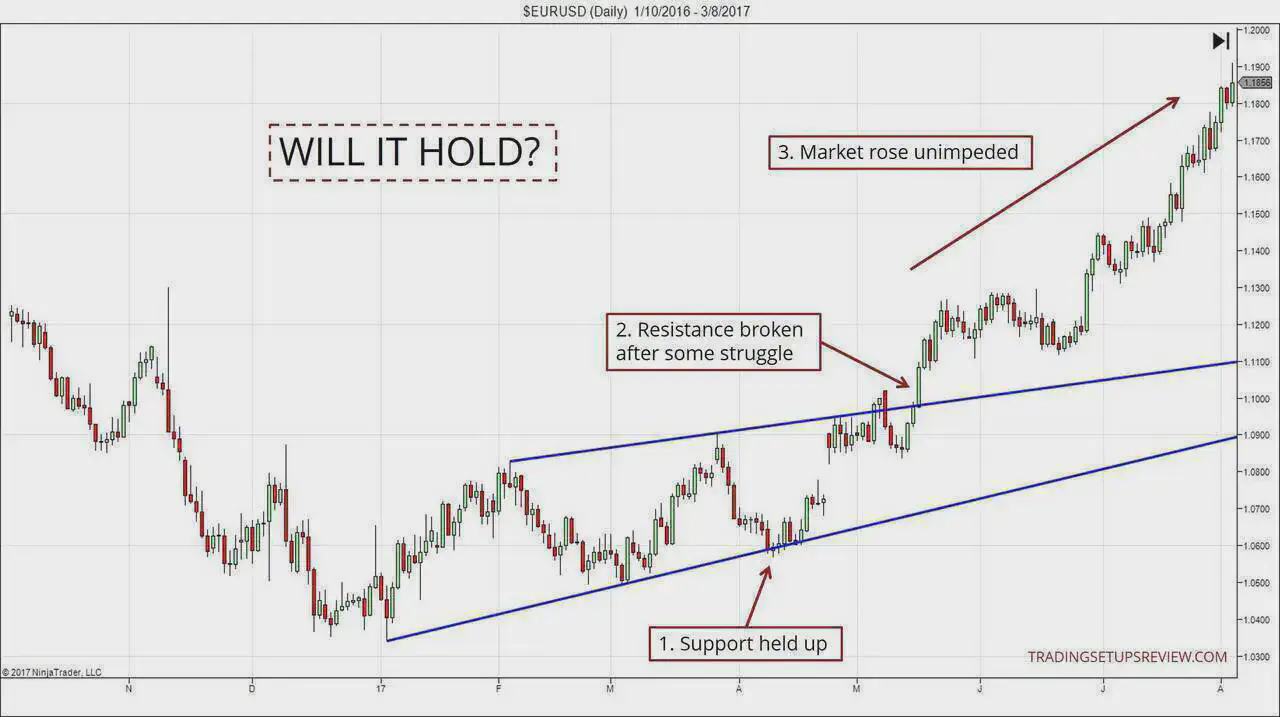
Imagine a stock price trapped between invisible walls on a chart.
The upper wall, known as resistance, represents a historical hurdle where the stock has struggled to move above due to selling pressure. The lower wall, called support, reflects a price level where buying interest has historically prevented further decline.
Now,
An interesting thing happens, when the price makes a decisive move and breaks free from these lines.
If it bursts above resistance, that's a bullish breakout, and it suggests the stock might be heading higher.
On the other hand, if it crashes through support, that's a bearish breakout, and it might signal a downtrend.
And this is when you can use these breakouts to your advantage
- Capitalize on Trending Moves: If you correctly identify a breakout in the direction of the underlying trend, you can enter trades that aim to profit from the price movement.
- Exit Stagnant Positions: If a stock you hold experiences a breakout against the prevailing trend, it might be a signal to exit your position and avoid potential losses.
- Gauge Market Sentiment: Breakouts can reflect a shift in market sentiment towards a stock or sector. Identifying these shifts can help you adjust your trading strategies accordingly.
So, how do you find these breakouts?
Yes, With the help of
Price Action Scanners
Configuring Scanners to Identify Breakout Opportunities
The Advantage of Price action scanners is that you can use these tools to scour the market for instruments that fit your criteria.
Here's how to set yours up for breakout success:
1. Price Channels: Set the scanner to identify instruments trading within a defined price channel (resistance and support) for a specific period. This sideways consolidation often precedes a breakout, where the price breaks free from the channel.
2. Breakout Conditions: Look for options to scan for price crossing above resistance (bullish) or below support (bearish). Specify a minimum percentage or fixed value above/below the channel for a clearer breakout signal. A larger percentage or value suggests a more forceful breakout.
3. Volume Filter: Include a volume filter to ensure the breakout is accompanied by a surge in trading activity. High volume on a breakout day strengthens its legitimacy and suggests increased volatility. Let's say the average daily volume for a stock is 100,000 shares. You might set a filter requiring breakouts to be accompanied by at least a 50% increase in volume (150,000 shares traded).
Remember,
these are just the basics. You can also add some extra filters to your scanner, like:
· Minimum Average Daily Volume (ADV): Focus on instruments with a history of active trading (e.g., ADV above 500,000 shares) to avoid illiquid breakouts that might fizzle out quickly.
· Minimum Price: Target instruments relevant to your strategy by setting a minimum price threshold (e.g., above $10).
· New Highs/Lows: Look for instruments reaching new 52-week highs (bullish) or lows (bearish) for potentially stronger breakouts, suggesting a significant shift in price momentum.
But wait,
there's a little problem!
Not all breakouts are created equal. Sometimes, the price fakes you out with a breakout that doesn't hold.
This is what we call , False Breakouts
Identifying and Avoiding False Breakouts
Breakouts aren't guaranteed successes. False breakouts mimic legitimate breakouts but ultimately fail to hold.
Here's how false breakouts can occur:
- Short-Term Buying Pressure: A temporary surge in buying interest might push the price above resistance, but it lacks the strength to sustain the move, leading to a quick reversal back below resistance.
- Stop-Loss Hunting: Traders often place stop-loss orders just below resistance levels. A false breakout can trigger these orders, causing a wave of selling that pushes the price back down.
So, how do you avoid these false breakouts with your scanner?
Here are some tricks:
Scanner Strategies to Mitigate False Breakouts
While not foolproof, scanners can help you avoid getting fooled by false breakouts:
- Refining Breakout Criteria:
- Minimum Price Movement: Set a minimum percentage or absolute price change for a valid breakout (e.g., 2% above resistance). This helps filter out minor fluctuations that might not represent a true trend shift.
- Timeframe: Consider using a slightly higher timeframe for breakouts compared to your trading timeframe (e.g., scan 1-minute charts but look for breakouts confirmed on 5-minute charts). This can smooth out short-term noise and identify more sustainable breakouts.
- Volume Confirmation: Require a minimum volume threshold for breakouts (e.g., 20% above average daily volume). This suggests stronger conviction behind the price move.
- Combining with Other Indicators: Don't rely solely on breakouts. Combine them with other technical indicators for confirmation of the underlying trend.
- Moving Average Crossovers: Look for breakouts that occur alongside a bearish or bullish moving average crossover for stronger signals. For example, you could scan for stocks experiencing a breakout above resistance with the 50-day moving average crossing above the 200-day moving average. This confluence of a breakout and a bullish moving average crossover strengthens the potential for a sustained uptrend.
- Relative Strength Index (RSI): Filter breakouts where the RSI isn't at extreme levels (typically above 70 for overbought or below 30 for oversold). For instance, you might only consider breakouts where the RSI is between 40 and 70. This suggests the stock isn't yet overbought (potentially leading to a short-lived breakout) and has room for further movement in the breakout direction.
Putting It All Together: A Breakout Example
Great ,
So by this time , you may have learnt quite a few things about breakouts
Let’s finish this by giving a detailed example.
Let's imagine you're a swing trader looking for potential long entry opportunities (buying opportunities) on a stock with a current price of $50. You configure your scanner based on the following criteria:
- Price Channel: The stock has been trading within a defined price channel for the past two months, with resistance at $52 and support at $48.
- Breakout Conditions: You set the scanner to identify breakouts above resistance with a minimum price increase of 2% (minimum breakout price of $52.40).
- Volume Filter: The scanner requires breakouts to be accompanied by a volume surge of at least 30% above the average daily volume (e.g., if the average daily volume is 1 million shares, then the breakout day volume should be at least 1.3 million shares).
One day, the scanner alerts you to a potential breakout opportunity. The stock price decisively breaks above $52.40 with a significant increase in trading volume, exceeding the filter requirements. This suggests a potentially strong breakout and a possible uptrend.
Hope this example may have clarified the things further
This brings us to the second part of our where we shift our focus on
2) Managing Volatility with Bollinger Band Squeezes and High Liquidity
Technical analysis offers valuable tools for managing volatility. This section explores two such techniques: Bollinger Band Squeezes and focusing on high liquidity stocks.
Bollinger Band Squeezes
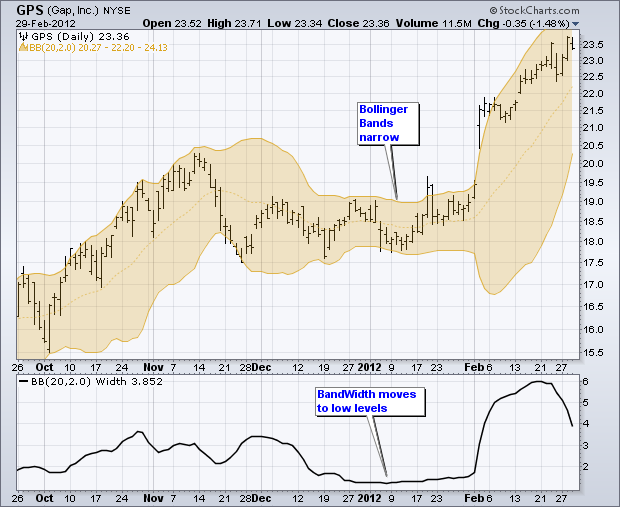
The Bollinger Band Squeeze is a technical indicator that identifies potential breakout opportunities based on volatility changes. It utilizes Bollinger Bands, which consist of a moving average (centerline), an upper band, and a lower band. The space between the bands represents volatility. When the upper and lower bands contract significantly, a squeeze occurs, signifying a period of low volatility. The underlying assumption is that compressed Bollinger Bands tend to be followed by a period of increased volatility, potentially leading to a breakout (price decisively breaching a Bollinger Band).
Refining Squeeze Detection (Optional)
- Band Width Threshold: You can refine your scanner to target especially tight squeezes by setting a threshold for the Bollinger Band width (e.g., a percentage below its average width over a specific period).
- Volatility Indicators (Optional): Some traders use additional volatility indicators like the Average True Range (ATR) to confirm low volatility periods.
Breakout Strategy and Confirmation
Once a squeeze is identified, you can set up a scan to monitor for potential breakouts. A clear breakout threshold (percentage above or below the Bollinger Band) should be defined to distinguish intended breakouts from minor fluctuations.
- Breakout Above Upper Band: This is generally considered a bullish signal, suggesting a potential price increase.
- Breakout Below Lower Band: This is generally considered a bearish signal, suggesting a potential price decrease.
Leveraging High Liquidity Stocks
Focusing on high liquidity stocks can also help manage volatility. Here's how:
- Reduced Slippage: High liquidity minimizes slippage (difference between desired and actual price) because there are more willing buyers and sellers.
- Efficient Order Execution: Orders are more likely to be filled quickly and efficiently with high liquidity.
- ** tighter Stop-Loss Orders:** High liquidity allows for tighter stop-loss orders, limiting potential losses.
Combining Scanners and High Liquidity
Price action scanners can be used with high liquidity filters to identify potentially profitable opportunities:
- Breakouts with Minimum Daily Volume: Scan for stocks breaking above resistance levels with a minimum daily trading volume filter. This ensures strong buying pressure behind the breakout, indicating a potentially strong move with manageable volatility due to the high liquidity.
- Scan Within Bollinger Bands with Bid-Ask Spread Filter: Scan for stocks trading within Bollinger Bands with a filter for a maximum acceptable bid-ask spread. This helps identify potentially tradable price movements within a controlled volatility environment.
Additional Tips
- Market Capitalization: Consider filtering for stocks with a moderate to large market capitalization, as these tend to be more liquid than smaller companies.
- Sector Selection: Some sectors are inherently more volatile than others. Focus on sectors known for relative stability if managing volatility is a key priority.
By incorporating these techniques, you can be better equipped to navigate volatile markets and potentially make informed trading decisions.
Remember,
Always conduct further analysis and consider risk management strategies before entering any trades. By effectively configuring your scanner and using these strategies in conjunction with other technical analysis tools, you can increase your chances of identifying true breakouts and navigating periods of increased volatility.
Trade Smarter!!


