Moving Averages and ATR: How to Cut Through the Noise for Swing Trading

We know that traders often use Technical Analysis for a quantitative approach to market analysis, reducing the impact of emotions and biases that often cloud judgment.
The Technical Indicators help in identifying the direction of a trend, Confirming Price Action and Timing Entries and Exits. They are also helpful in setting set stop-loss and take-profit levels.
However,
it's crucial to remember that no indicator is perfect.
And what you believe a strong indicator signal may turn out to be Just the NOISE!
Yes,
The Noise, which seem to be a trading signal but in actuality is random price fluctuation that can obscure the true signal.
So, In the blog post below, we will discuss how moving averages and ATR , the two most commonly used signals by traders, can benefit swing traders, and how do you separate the market noise from the signals created by these two indicators.
Lets Start
1) Using Moving Averages based Signals for Swing Traders
Moving averages (MAs) are among the most fundamental and widely used technical indicators in swing trading. They smooth out price data over a specified period, providing a clearer picture of the underlying trend.
How does Using Moving Average benefit the Swing Traders?
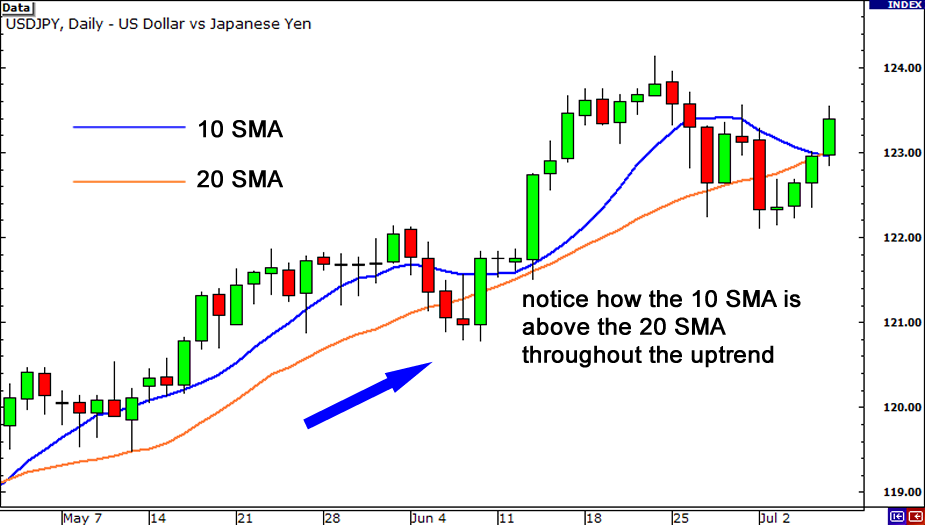
MAs are excellent for determining the overall trend direction. A price above a moving average typically indicates an uptrend, while a price below suggests a downtrend.
MAs also act as dynamic support and resistance levels. When the price bounces off a moving average multiple times, it can signal a potential reversal or continuation of the trend.
This provides the swing traders the opportunity to Identify Potential Entry and Exit Points For Example, A shorter-term MA crossing above a longer-term MA is often seen as a bullish signal, while the opposite suggests a bearish trend.
But,
How do you Separate a Moving Average based Signal from the Noise?
While moving averages are powerful tools, they are not infallible. To effectively use them, it's crucial to minimize noise and extract meaningful signals.
Experienced traders generally employ two methods for this
The First one is
Choosing the Right Timeframe
The choice of moving average period is crucial for swing traders. A shorter-term MA (e.g., 50-day) is more responsive to price changes, while a longer-term MA (e.g., 200-day) provides a smoother trend line. Using a combination of both can help filter out noise.
Lets take an example;
Let's say, a swing trader is interested in trading a particular stock, XYZ. They decide to use a 50-day moving average to identify potential trend reversals.
The Problem arises, when the trader enters a long position based on a bullish crossover of the 50-day MA, believing it signals a new uptrend. However, instead of rising upwards, the stock price quickly reverses, leading to a loss.
The issue lies in the choice of timeframe. A 50-day MA is relatively short-term and might be too sensitive to market noise in this case. The rapid price reversal suggests a short-term fluctuation rather than a sustainable trend change.
Did you notice?
This is the noise that we are talking about.
So what's the solution?
a confirmation from a longer term moving average!
A longer-term moving average, such as a 200-day MA, would have provided a more accurate picture of the underlying trend. If the price was below the 200-day MA, it would have indicated, for example, a potential downtrend, preventing the trader from entering a long position prematurely.
Therefore,
Using the 200-day MA would have helped the trader to Identify the broader trend. A position below the 200-day MA would suggest a bearish bias, preventing a long entry.
Another strategy of swing traders is To use
Multiple Moving Averages
See,
Employing multiple moving averages can strengthen signal confirmation.
For instance, a bullish crossover of a 50-day MA over a 200-day MA is often considered a strong buy signal.
For Example,
Let's take a Scenario,
Let's say you are analyzing a 50-day and a 200-day moving average to identify potential trend changes.
Your Initial Observation is that the stock price has been declining for several weeks, and it's currently trading below both the 50-day and 200-day moving averages. indicating a strong downtrend.
Amid this situation, a Potential Buy Signal arises, The price starts to rise and eventually crosses above the 50-day moving average.
But wait, You don’t need to jump into the trade right away.
While this could be a bullish signal, it's not definitive yet.
Take the Confirmation!
You need to wait to see the price rise and eventually cross above the 200-day moving average as well. This crossover, known as a "golden cross," provides stronger confirmation of a potential uptrend reversal.
This trade confirmation should give you a Trading Decision.
Based on this combined signal, You can decide to enter a long position, expecting the price to continue rising.
Combining with Other Indicators
This is an important aspect to consider while using moving averages.
Using moving averages in conjunction with other indicators can enhance their effectiveness. For example, combining with RSI or Bollinger Bands can provide additional confirmation and help identify potential overbought or oversold conditions.
2) Using Average True Range (ATR) based signals for Swing Traders
In one of our previous blogs, we discussed that The Average True Range (ATR) is a valuable tool for placing Stop Loss Orders for swing traders,
But It is an equally important tool for the identification of trade opportunities.
How does ATR Help Swing Traders?
The exceptional ability of ATR for Volatility Measurement helps identify periods of high and low volatility. High ATR indicates increased price swings, while low ATR suggests a calmer market.
As a result, ATR becomes a tool for Risk Management as well. High volatility might warrant smaller position sizes or tighter stop-loss levels.
ATR can be used to set dynamic stop-loss and take-profit levels. For example, a stop-loss could be placed a certain number of ATRs below the entry price.
As volatility changes, the stop-loss and take-profit levels adjust accordingly, providing a more flexible risk management approach.
and How does ATR identify trading Opportunities?
ATR is also very helpful in Identifying Potential Breakouts
A significant increase in ATR can often precede a breakout. This information can be used to confirm a potential breakout and time entries accordingly.
Conversely,
a low ATR might indicate a false breakout, helping traders avoid unnecessary trades.
Not only that,
Most of the experienced traders use ATR in Identifying Trading Ranges
ATR can help identify potential support and resistance levels based on historical volatility. Traders can look for opportunities to buy near support and sell near resistance, using ATR as a gauge of potential price movement.
This works well in not only for Range Bound Markets but also for finding Swing Trading opportunities in Volatile Markets.
So,
How do you separate Noise from ATR-based Signals?
While ATR provides valuable insights into market volatility, it's essential to distinguish between actual volatility changes and random price fluctuations (noise).
As with Moving Averages above, Experienced traders employ two main techniques to achieve this:
Timeframe Analysis and ATR
By examining ATR on multiple timeframes, traders can gain a clearer picture of market volatility and its impact on price movement.
How It Works?
Let's explain,
See, Short-term Timeframes, Capture rapid price fluctuations and short-term volatility spikes. Therefore, High ATR readings on short-term timeframes (like 5-minute or hourly) might indicate increased noise or false breakouts.
So, It becomes important to have a look at the Long-term Timeframes
These time frames reflect broader market trends and underlying volatility patterns. Consistent high ATR readings on daily or weekly charts suggest a more significant increase in volatility, potentially indicating a trend change or breakout.
This Correlation Analysis, by Comparing ATR values across different timeframes can reveal relationships between short-term and long-term volatility.
Let's take an Example:
Lets say you observed a significant increase in the ATR on a 1-hour chart. Initially, this might suggest a potential breakout. However, upon examining the daily and weekly ATR, you notice no significant changes. This discrepancy indicates that the increased volatility on the 1-hour timeframe is likely noise rather than a meaningful shift in market conditions.
Combining ATR with Price Action
Price action analysis is the art of interpreting raw price data without relying solely on indicators.
What professional traders do is Combine price action with ATR. This provides a more comprehensive understanding of market dynamics.
How?
Let's See,
For Example,
We know that an increasing ATR often precedes a breakout. However, price action can help confirm the breakout's validity. A strong candlestick pattern (like a bullish engulfing candle) following a period of high ATR can signal a genuine breakout.
Similarly,
Sometimes, high volatility leads to false breakouts. Price action can help identify these as well.
For instance, a doji or spinning top candlestick after a sharp price move and high ATR might indicate a potential reversal.
Price action can also help in Determining Range-Bound Markets.
In sideways markets, ATR might remain relatively high, but price action will show a lack of directional bias. This combination suggests a range-bound market.
Also,
When a strong trend is in place, price pullbacks often occur. An increasing ATR during a pullback, coupled with price action that respects support levels, can signal a potential buying opportunity.
The Key Benefits of this combination?
Enhanced Decision Making
&
Reduced False Signals.
A winning combination for any trader!
Conclusion
Moving averages and ATR is essential for any swing trader . By understanding how to identify trends, potential entry and exit points, and differentiate between meaningful signals and noise, traders can significantly enhance their trading performance. While these indicators provide valuable insights, combining them with price action analysis and employing techniques like timeframe analysis is crucial for making informed decisions.
Trade Smarter!


