How to Use Stock Screeners for Advanced Screening Techniques

From our previous blog on Stock Screeners: What are they and how and Why to use them, We know that Stock Screeners can be a great tool for finding trading opportunities.
But,
Basic stock screening using a single metric offers a simplistic view of a company's health. It can lead you to miss out on good opportunities or even steer you towards bad investments.
Here's why,
Single Metric can give you an incomplete picture. For Example, a Metric, like a high P/E ratio, might indicate a growth stock, but it doesn't tell you if the company is profitable or has a high debt burden.
Similarly, It can also Miss the context. For example, A low price-to-book ratio could suggest a value stock, but without considering industry averages or growth potential, you might miss out on undervalued but promising companies.
This can lead to False positives. Focusing solely on a single metric like for example high dividend yield might lead you to financially troubled companies using dividends to attract investors.
So,
Basic screening is a good starting point, but relying solely on it can be misleading. You need to consider a combination of factors to make informed investment decisions.
How to Combine Different Filters for Advanced Screening in Stock Screener?
Alright,
So, You may be using the Stock Screener for finding some exciting trading opportunities, But may not be getting the desired results.
Wonder what experienced traders do?
Experienced Tradersdo one particular thing.
They either combine different Filters allowing them to narrow down the search based on various criteria like company size (market cap), financial health (P/E ratio, debt-to-equity), and dividend payouts
Or
Add Technical indicators that help analyze historical price and volume data to identify potential buying or selling opportunities based on technical analysis principles.
By combining these tools, you can also create a more targeted approach to stock selection. You can screen for companies that meet your fundamental requirements (filters) and also exhibit technical signals that align with your trading strategy (indicators).
But how do you do this?
Let’s understand each approach.
Combining Multiple Filters through Logical Operators.

When using advanced stock screeners, you can combine different filtering criteria to narrow down your search for specific types of investments. This is achieved through logical operators, similar to the ones you might use in everyday language.
Here's a breakdown of the three main ones:
AND: This operator requires all the conditions you specify to be true for a stock to show up in your results. For Example, You may want to find stocks with a P/E ratio below 15 AND a market capitalization exceeding $1 billion. Both conditions must be met for a company to be included. To do this, you add the “AND” filter in your criteria.
OR: This operator allows at least one of the conditions you specify to be true for a stock to be included. For Example, You want to identify companies with a dividend yield above 3% OR a growth rate exceeding 20%. A stock can be included if it meets either of these criteria.
Similarly,
NOT operator excludes companies that meet a specific condition. For example, You want to screen for stocks with a P/E ratio below 15 but NOT in the financial sector. This eliminates companies in finance even if their P/E meets your requirement.
Here's why balance is important.
You see,
Each filter acts as a hurdle. Stacking too many filters can significantly reduce the number of potential companies, potentially excluding hidden gems that might not perfectly tick every box.
Also,
The market offers a variety of investment styles. An overly restrictive screen based on specific criteria could miss out on entirely different sectors or investment opportunities.
Utilizing Technical Indicators.
Alright, So
Stock screening with filters is great for finding companies that meet your fundamental criteria.
But what about timing your entry and exit points?
This is where technical indicators come in.
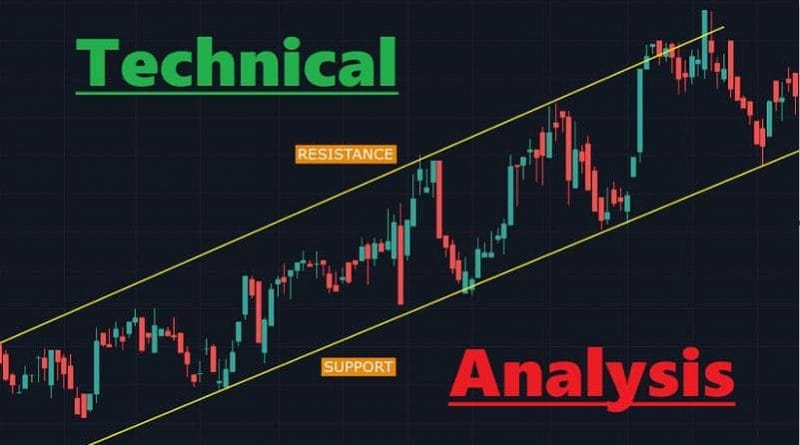
Technical indicators are mathematical calculations based on historical price and volume data. They're a core part of technical analysis, a discipline that focuses on identifying trading opportunities by studying past market behavior.
Technical indicators can help identify trends in price movements, like uptrends, downtrends, or consolidation periods.
Some indicators can suggest if a price move is gaining or losing momentum, potentially signaling potential buying or selling opportunities.
Certain indicators can indicate when a stock might be overbought (priced too high) or oversold (priced too low) based on recent price movements.
So,
How to Use Filters along with Technical Indicators?
Here's how to combine filters with technical indicators for stronger signals.
But before that,
Please note that below are just three examples of many Technical Indicators that can be used in combination with many other filters. This is just to give you an idea as how things work while combining these filters.
Combining Filters with Moving Averages (MA)
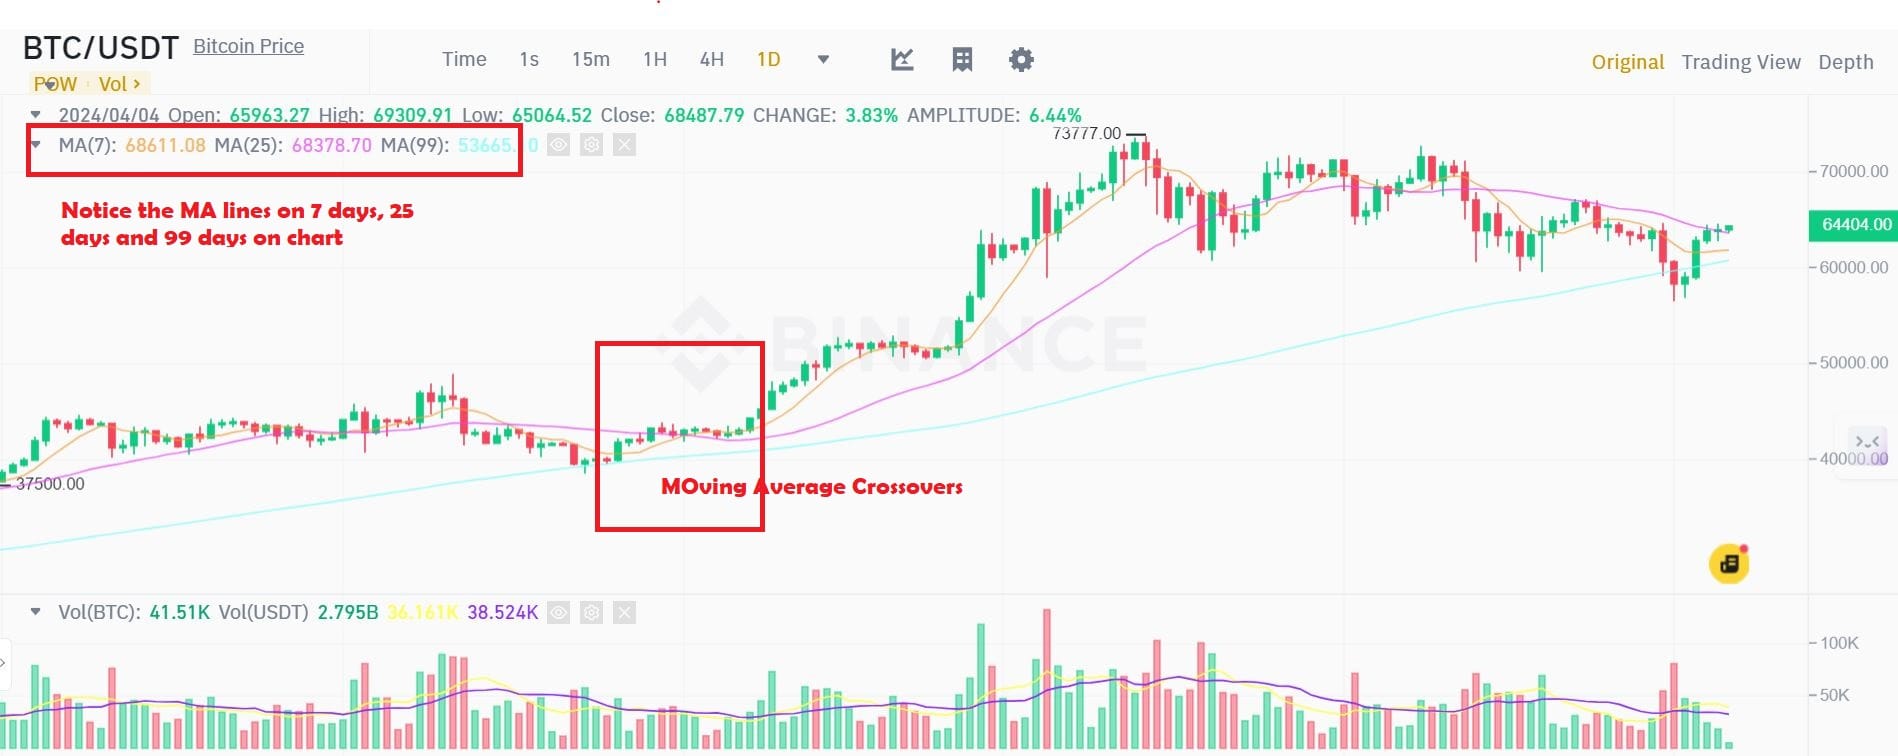
We all know that Moving Averages smooth out short-term price fluctuations to reveal the underlying price direction. This helps investors identify potential uptrends and downtrends.
So, Here is how you can Combine Value and Uptrend Signals
For Example, You can Start by using a filter for a specific P/E ratio range (e.g., below 20). This suggests the stock might be undervalued compared to its earnings potential.
Next, in the second filter, you can combine the P/E ratio filter with a technical indicator like the moving averages. Look for stocks where the 50-day moving average is currently above the 200-day moving average (upward slope). This confluence of signals suggests a potential uptrend for a potentially undervalued company.
Why this works?
This two-pronged approach helps you find stocks that might be
Trading at a discount, The P/E ratio filter targets stocks that may be undervalued based on their earnings
And
Experiencing a positive momentum shift. The uptrend confirmation from the moving averages suggests the stock price might be on an upward trajectory, potentially amplifying any future gains.
Combining Moving Average Convergence Divergence (MACD) with Filters
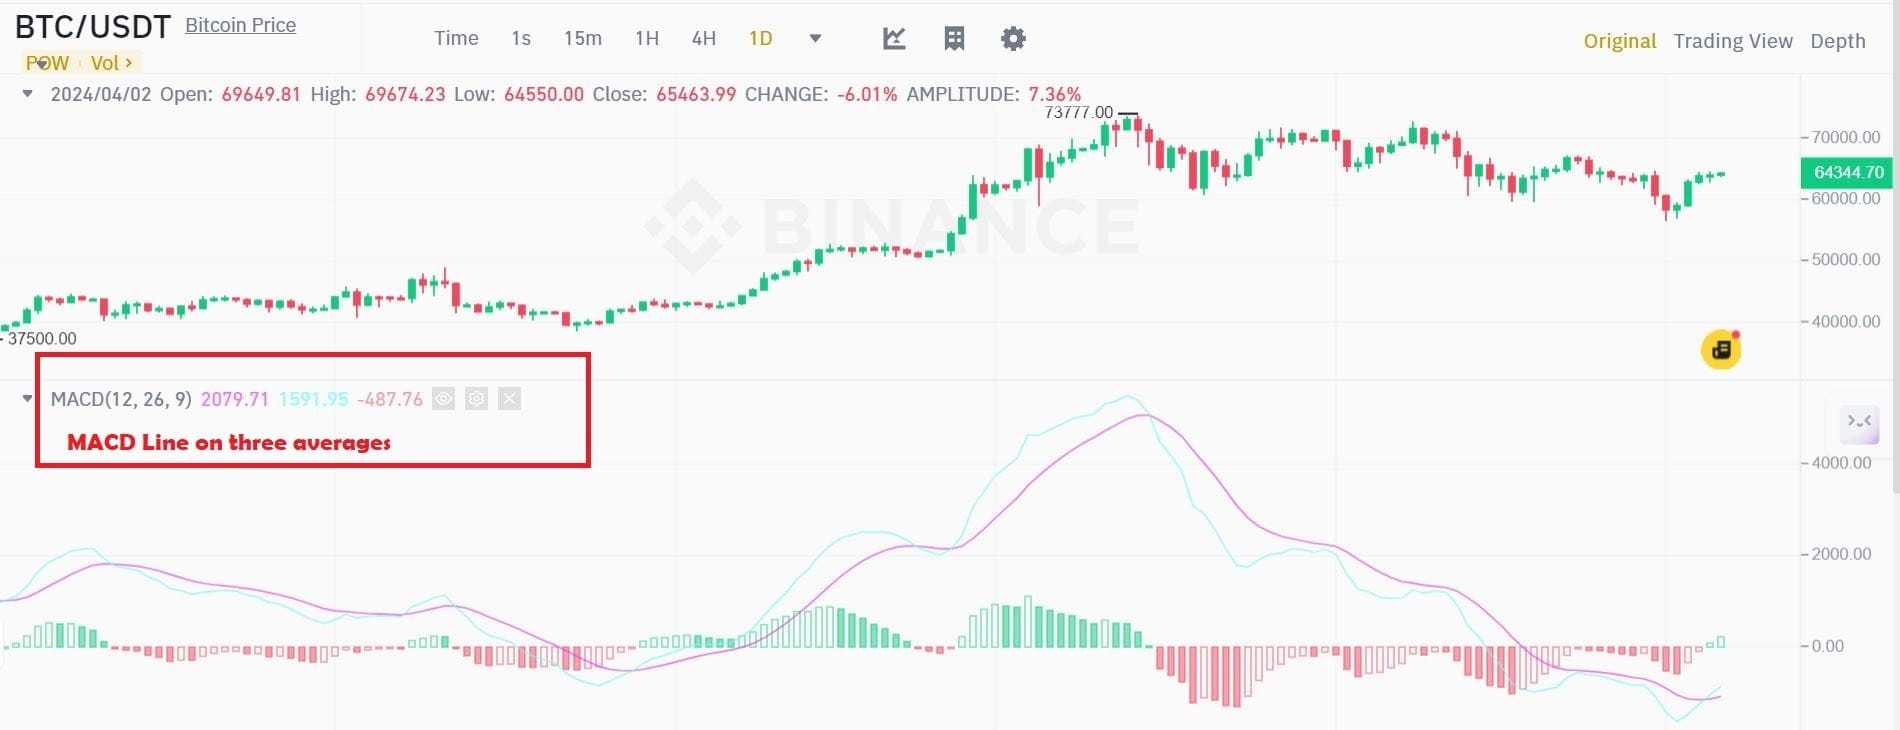
MACD is a technical indicator that analyzes the relationship between two moving averages of a stock's price. It helps identify trend direction, momentum (strength of the trend), and potential reversal points.
So, how can you use this technical indicator with some additional filter?
Let’s take an example,
For this, In Filter 1, You may Prioritize Financial Strength. You can Start by using a filter for a healthy debt-to-equity ratio (e.g., below 1). This indicates the company has a manageable debt level compared to its equity, suggesting financial stability.
For Filter 2, you can combine the debt-to-equity ratio filter with the MACD indicator. Look for stocks where the MACD line crosses above its signal line. This suggests a potential uptrend in a company with a solid financial foundation, potentially indicating strong momentum for future price increases.
Why this works:
This combined approach targets companies that are:
Financially stable
The debt-to-equity ratio filter ensures the company has a manageable debt load, reducing potential risk.
And,
Experiencing accelerating growth. The MACD crossover suggests the stock's price is not only trending upwards but also accelerating, potentially leading to significant gains.
Combining Volume Indicators with Filters
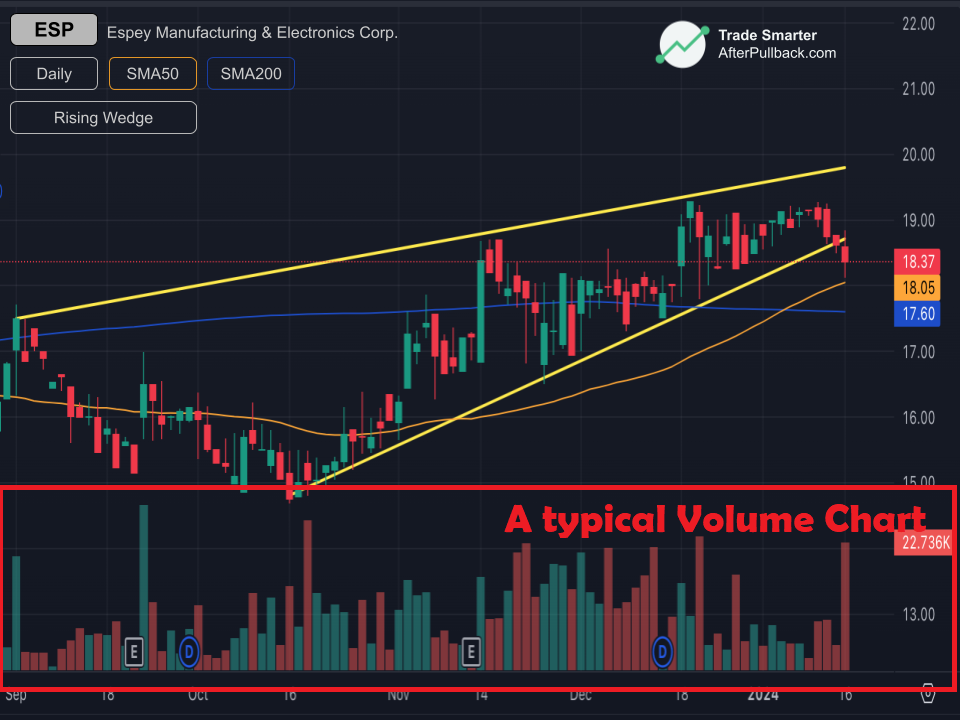
Volume refers to the number of shares traded in a stock on a given day. By analyzing volume trends, investors can gauge buying and selling pressure, potentially identifying breakouts, breakdowns, and periods of high interest.
Let's take an example to understand how you can combine Volume with some other filters.
Let's say, you may be looking for a company that is showing growth with a buying momentum.
For this, You can Start by using a filter for a strong track record of revenue growth (e.g., exceeding 10% annually for the past 3 years). This indicates the company is experiencing consistent expansion.
You can combine the revenue growth filter with a volume indicator. For example, you can look for stocks with a recent surge in trading volume that coincides with a significant price increase. This confluence suggests strong buying pressure alongside the company's proven growth record, potentially indicating a period of accelerated price appreciation.
Why this works?
This approach focuses on companies that are:
Demonstrating consistent growth
The revenue growth filter highlights companies with a history of expanding their business, suggesting future profitability potential.
And,
Experiencing increased investor interest.
The surge in volume with a price increase suggests a potential breakout, where more investors are piling into the stock, potentially driving the price even higher.
Remember: These are examples. Experiment and adapt your approach!
Using Event-Based Screening:
Professional Traders have some secrets for scanning the stocks. They don’t just look at the company financials and technical indicators. They also capitalize on upcoming events that might impact stock prices
What kind of events?
Traders target Specific Events Like, for example, Stock Splits
A stock split increases the number of shares outstanding without affecting the total company value. Stock splits don't change a company's underlying value, but they can increase stock liquidity by making shares more affordable for individual investors. This can lead to a temporary price increase due to higher demand. A lower share price might make the stock seem more attractive to some investors, further boosting demand and potentially leading to a short-term price bump.
Similarly,
They can target Earnings Announcements. Companies periodically release quarterly or annual earnings reports. Strong earnings can lead to stock price increases, while disappointing results might cause a drop.
Also, Product Launches can also be the event to look for. Highly anticipated product launches can generate excitement and potentially drive up a company's stock price.
How to Utilize Screening Tools for this?
Many stock screeners offer filters for event-based searches.
In Calendar-Based Filters, You Look for screeners with built-in calendars that allow you to search for stocks with upcoming events like earnings announcements or product launches.
Some Stock Screeners may also offer
Event-Specific Filters. Like specific filters for stock splits (e.g., "Upcoming Stock Splits").
Let's take an Example of how to use such a screener in real life.
Imagine you're interested in companies with upcoming earnings announcements. You can use a screener to:
- Set a date range for earnings announcements (e.g., within the next week).
- Combine this filter with criteria like P/E ratio and growth rate to identify companies with both solid financials and upcoming earnings potential.
- Research these companies further to understand their earnings history, analyst expectations, and overall market sentiment.
By using event-based screening strategically, you can stay informed about potential market movers and identify companies with upcoming catalysts that might align with your investment goals.
Remember, a well-rounded approach that combines event-based screening with other analysis techniques can empower you to make more informed investment decisions.
Pro Tips and Best Practices for Mastering Stock Screening
Stock screening is a powerful tool for investors, but using it effectively requires a strategic approach.
Here are some pro tips and best practices to help you get the most out of your screening process:
1. Start Broad, Refine Gradually:
Begin with a wider pool of companies. Avoid overly restrictive criteria at the outset. Cast a broad net to capture a diverse range of potential investments that meet your general investment goals (e.g., growth stocks, value stocks, dividend payers).
Progressively add filters. Once you have an initial set of companies, start adding filters based on your specific preferences. Look for criteria that align with your risk tolerance, investment style, and sector preferences.
2. Prioritize Key Criteria:
Focus on the essentials. Not all filters are equal. Identify the most crucial criteria that are non-negotiable for your investment goals. These might include financial ratios like P/E ratio, debt-to-equity ratio, or specific industry sectors.
Don't get bogged down. Avoid adding too many irrelevant filters that might cloud your search and limit your options unnecessarily.
3. Leverage the Power of Combining Techniques:
Don't rely solely on filters: Combine fundamental filters with technical indicators for a more comprehensive approach. Technical indicators can help you identify potential entry and exit points based on historical price and volume data.
4. Backtest Your Strategies:
Backtest your filters with historical data. Don't just throw on filters and hope for the best. See how your screening criteria would have performed in the past. This can help you identify if your filters would have captured profitable opportunities &
Refine and adapt. Based on your backtesting results, adjust your screening criteria to improve their effectiveness.
Conclusion
Basic screening is like a flashlight in the dark - it helps you see, but you might miss hidden gems. Advanced techniques offer a laser focus to Target companies that align with your goals and risk tolerance. Refine searches efficiently to save time and effort & Uncover promising companies that might be under the radar.
But Remember.
Research is key
Don't skip due diligence before investing.
Trade Smarter!


