How to manage Stop Loss and Profit Targets using Pivot Points and Pullbacks- A Comprehensive guide

This guide outlines a detailed, step-by-step approach to a trading strategy that utilizes pivot points and Average True Range (ATR) to identify entry and stop-loss levels in trending markets. This will also discuss important considerations while setting Profit Targets. Overall, we will discuss the following steps in this guide.
Step 1: Preparing Your Trading Platform
Step 2: Identifying Uptrends
Step 3: Recognizing Pullbacks
Step 4: Entry Confirmation
Step 5: Entry and Stop-Loss Placement
Step 6: Taking Profits in Steps
Important Note: This is for educational purposes only and should not be considered financial advice. Always conduct your own research and backtest any strategy before deploying it with real capital.
Step 1: Preparing Your Trading Platform
Key Takeaway for Step 1
- Chart Selection: Choose a chart that displays price history alongside technical indicators.
- Market Selection: Focus on markets that exhibit strong trending behavior. Forex pairs, commodities, and certain indices can be good candidates.
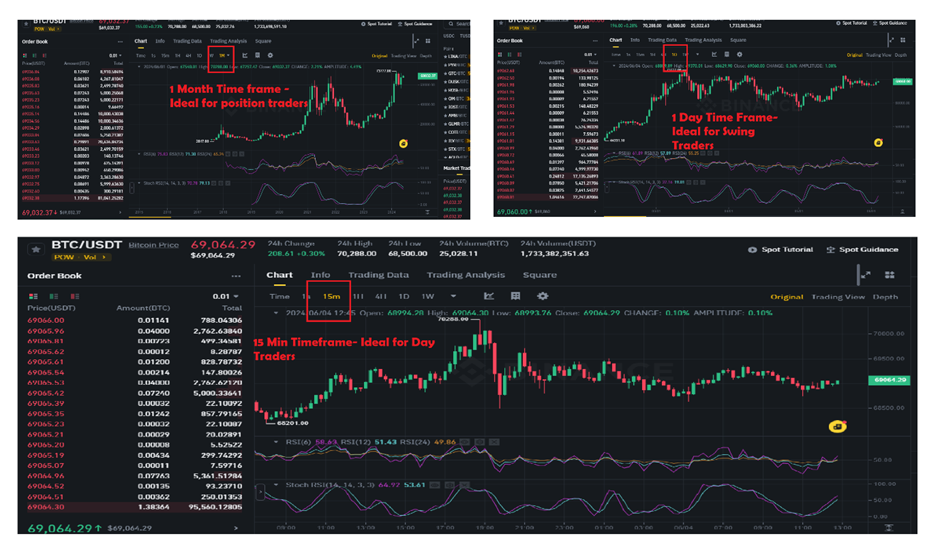
- Timeframe Selection: Select a timeframe that suits your trading style. Day traders might prefer intraday charts (e.g., 15-minute, 30-minute), while swing traders might opt for higher timeframes (e.g., daily, 4-hour).
- Indicator Selection: Add the following indicators to your chart:
- Moving Average:
- Pivot Points:
- Average True Range (ATR)
Ok, So
The First Step is to start with a
1) Chart Selection
You can choose a chart that displays price history alongside technical indicators. For this, there are many popular options in the market. You can use AfterPullack or any of your broker's proprietary platform. Ensure the chart allows customization of indicators and timeframes.
Once you have finalised the brokerage platform , we move on to the
2) Market Selection
When employing a trend-following strategy like this, selecting instruments that exhibit clear trending behavior is crucial.
Why trending markets?
Because, Trending markets offer directed price movements, either consistently upwards (uptrend) or downwards (downtrend). This characteristic of trends allows you to capitalize on the potential for extended price movements in your chosen direction.
What kind of Markets show strong trends?
Another important question that you need to ask yourself.
The Answer to this is markets that exhibit strong trends can be good candidates .
Examples include Items like Forex Pairs. Certain forex pairs, like major pairs (EUR/USD, USD/JPY, GBP/USD) or some commodity-linked currencies (AUD/USD, NZD/USD), can exhibit strong trends, especially during periods of economic strength or weakness in their underlying economies.
You can also choose Commodities.
Commodities like crude oil, gold, or natural gas are known for trending behavior due to factors like supply and demand dynamics, geopolitical influences, and global economic conditions.
And yes, also Indices. Stock market indices that represent broad sectors or entire economies can also trend. For instance, the S&P 500 (US) or DAX (Germany) might exhibit uptrends during periods of economic growth or downtrends during recessions.
So once the market and the trend is identified,
We move to the
3) Timeframe Selection
See, The timeframe you choose for your trading strategy is just as important as the strategy itself. It should align with your trading style, available time commitment, and risk tolerance.
Financial markets offer a variety of chart timeframes, each displaying price movements over different periods. Common options include:
Intraday Timeframes (1 minute - 1 hour): Display price movements within a single trading day. Examples include 15-minute, 30-minute, and 1-hour charts.
Daily Timeframe: displays price movements over a single trading day, offering a broader view of the market compared to intraday charts.
Higher Timeframes (4-hour, Daily, Weekly, Monthly): These charts condense price movements over longer periods, providing a more holistic view of the market trend.
So how do I know which timeframe to choose from?
Remember we said that the timeframe selection should be matching with the Trading Style?
This is what we meant.
If you are a Day Trader, meaning, If you have the time and discipline to actively monitor the markets throughout the day, intraday timeframes (15-minute to 1-hour) might be suitable. These charts provide greater detail on short-term price movements that our strategy can utilize for identifying entry and exit points.
Similarly, If you are a Swing Trader, a trader, who prefer a more balanced approach can opt for daily or higher timeframes (4-hour, Daily). These timeframes offer a better sense of the overall trend while still allowing you to identify potential entry and exit points using the 3-ATR strategy. Additionally, they require less active monitoring compared to intraday charts.
In the end come the Positional Traders, Traders with a longer-term perspective might consider even higher timeframes (Weekly, Monthly). While the 3-ATR strategy might be less applicable for very long-term positions, understanding the overall trend on these timeframes can help you identify potential entry points for longer-term trades that align with the uptrend direction.
So,
Once the trending market and the timeframe is finalized, we move on to the
4) Indicator Selection
Selecting the right technical indicators is crucial for any trading strategy For our strategy, add the following indicators to your chart:
1. Moving Average (MA): A Directional Filter
The moving average (MA) smooths out price fluctuations, revealing the underlying trend direction. It acts as a directional filter for your 3-ATR strategy. A common setting is the 50-period moving average (either SMA or EMA). This timeframe provides a good balance between smoothing out noise and capturing the underlying trend.
And guess what, moving averages can also give you a Confirmation of Uptrend. In an uptrend, the price should consistently trade above the moving average. Additionally, the moving average itself should slope upwards, visually confirming the rising trend direction.
2. Pivot Points: Identifying Potential Support and Resistance
Pivot points are calculated based on the previous day's trading range (high, low, and close). They generate additional price levels (support and resistance zones) that can act as potential entry and exit points for your trades.
How do they help? While not a definitive predictor of future price movements, pivot points can act as areas where the price might encounter buying or selling interest. During an uptrend, pullbacks towards S1, S2, or S3 levels can be potential entry zones for your 3-ATR strategy, provided other confirmation signals (like bullish price action) are present.
3. Average True Range (ATR): Setting Stop-Loss Levels
The Average True Range (ATR) is a volatility indicator that measures the average range (difference between high and low) of a price over a chosen period (e.g., 14 days).
The formula is something like this ,
ATR = (Average of (Previous Day's True Range, Absolute Value of Current Day's High Minus Previous Day's Close, Absolute Value of Current Day's Low Minus Previous Day's Close))
The ATR helps you set a reasonable stop-loss distance for your trades. A common approach is to place your stop-loss at least 1 ATR below your entry price. This limits potential losses if the price movement goes against your expectations. However, you can also consider using a multiple of ATR (e.g., 2 ATR) for more volatile markets depending on your risk tolerance levels.
Step 2: Identifying Uptrends
Key takeaway of step 2
Trends can be identified through
- Moving Average: The relationship between the price and the moving average helps identify the trend.
In an uptrend, the price should consistently trade above the moving average, with the moving average itself sloping upwards.
In a downtrend, the price should consistently trade below the moving average, with the moving average sloping downwards.
- Higher Highs and Lower Lows: Price patterns can further confirm the trend.
An uptrend is characterized by a series of higher highs (each peak higher than the previous) and higher lows (each trough higher than the previous).
A downtrend is characterized by a series of lower highs (each peak lower than the previous) and lower lows (each trough lower than the previous).
Our strategy thrives in trending markets, so accurately identifying trends can improve your trading performance. Here are the two key methods to identify trends.
1. Moving Average Confirmation:
The moving average (MA), as discussed earlier, acts as a directional filter for your strategy.
In a clear uptrend, the price should consistently trade above the moving average. This indicates that the overall price movement favors buyers, pushing the price higher.
Conversely, in a downtrend, the price should consistently trade below the moving average, reflecting selling pressure driving prices lower.
The slope of the moving average itself reinforces the trend direction:
- Upward Slope: Confirms a rising trend in uptrends.
- Downward Slope: Confirms a falling trend in downtrends.
But,
You should know, that moving averages are lagging indicators, meaning they react to past price movements. They might not immediately capture a sudden shift in trend direction.
2. Higher Highs and Higher Lows and Vice Versa
Another great method to identify the trends. Trends are characterized by a sequential progression of highs and lows in a particular direction.
Look for a series of higher highs (each peak higher than the previous) and higher lows (each trough higher than the previous). This signifies buying pressure and an overall upward trend.
Conversely, in a downtrend, you'll see lower highs (each peak lower than the previous) and lower lows (each trough lower than the previous). This indicates selling pressure and a downward trend.
Trendlines help visualize the trend direction:
In uptrends, connect the swing lows with a trendline. The trendline should slope upwards, confirming the rising trend.
In downtrends, connect the swing highs with a trendline. The trendline should slope downwards, confirming the falling trend.
Carefully examine the price action on your charts. Look for swing highs (peaks) and swing lows (troughs).
Confirm if they follow the uptrend or downtrend pattern as identified above.
ProTip: To strengthen your uptrend (or downtrend) identification, look for these elements to occur together. The price should consistently trade above the moving average for uptrends, and below for downtrends AND The chart should exhibit a series of higher highs and higher lows for uptrends, or lower highs and lower lows for downtrends.
Step 3: Recognizing Pullbacks
Key takeaway for Step 3:
In this step, you look for Pullbacks in the existing trends
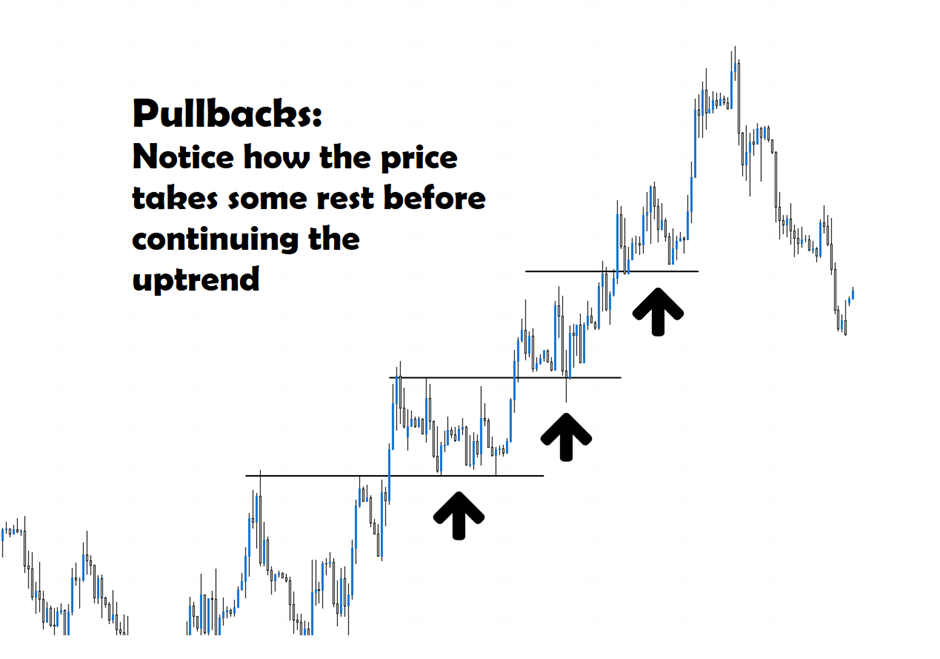
- Price Retracement: Within an uptrend, the market will experience occasional pullbacks or retracements. These are temporary dips in price that pull the price lower from its recent highs.
- Support Zones: During a pullback, look for the price to find support at specific price levels. Pivot points, particularly S1, S2, or S3 levels (calculated based on the previous day's high, low, and closing price) can act as potential support zones.
So,
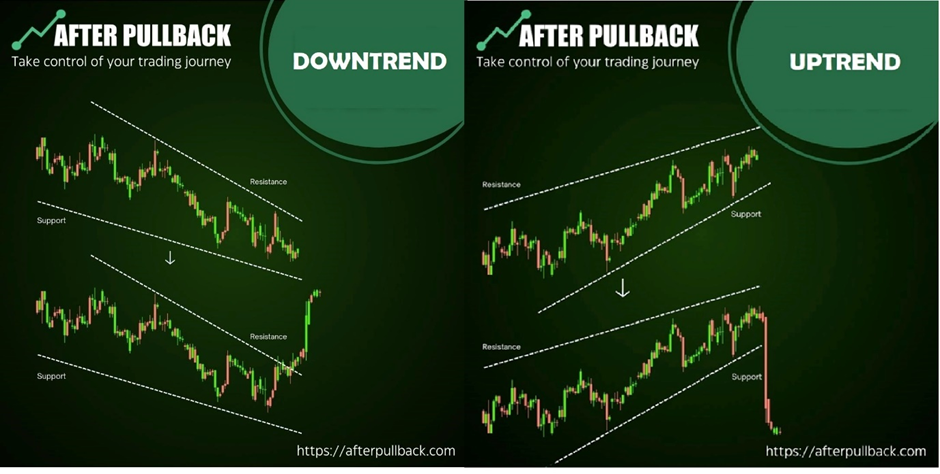
No trend moves in a perfectly straight line. Both uptrends and downtrends experience pullbacks or retracements. Pullbacks are temporary price movements that go against the prevailing trend.
In uptrends, pullbacks are downward price movements. In downtrends, pullbacks are upward price movements.
Pullbacks are really healthy for the trend.
Why?
Because They allow the market to consolidate gains (uptrend) or losses (downtrend), with sellers taking profits and potential new buyers emerging.
Pullbacks can also help validate the underlying trend. If the pullback finds support in an uptrend (or resistance in a downtrend) and the trend resumes, it strengthens the overall trend direction.
So, How do you recognize a Pullback?
You can observe how the price behaves during a pullback. The price movement should be relatively smooth and controlled, without sharp drops or excessive volatility.
Pullbacks also have a Limited Duration. They are generally short-lived compared to the overall trend. They typically last for a few days or weeks, depending on the market and the timeframe you're analyzing.
And, How do you Identify Support Zones with Pivot Points in pullbacks?
During a pullback, the price often finds support at specific price levels. These support zones act as a buying area where buyers might step in, preventing the price from falling further and potentially reversing the uptrend.
Pivot points, calculated based on the previous day's trading range (high, low, and close), can also provide valuable insights into potential support zones. Specifically, the S1, S2, and S3 levels (calculated below the pivot point) often act as areas where the price might encounter support during a pullback.
There is another point to consider here
While pivot points offer a valuable tool, you can also Look for previous swing lows (established bottoms) that might hold as support during a pullback. Similarly, The moving average itself can also act as a dynamic support zone, especially if the uptrend has been well-established.
Step 4: Entry Confirmation
Key Take Away for Step 4
You can confirm your entry based on;
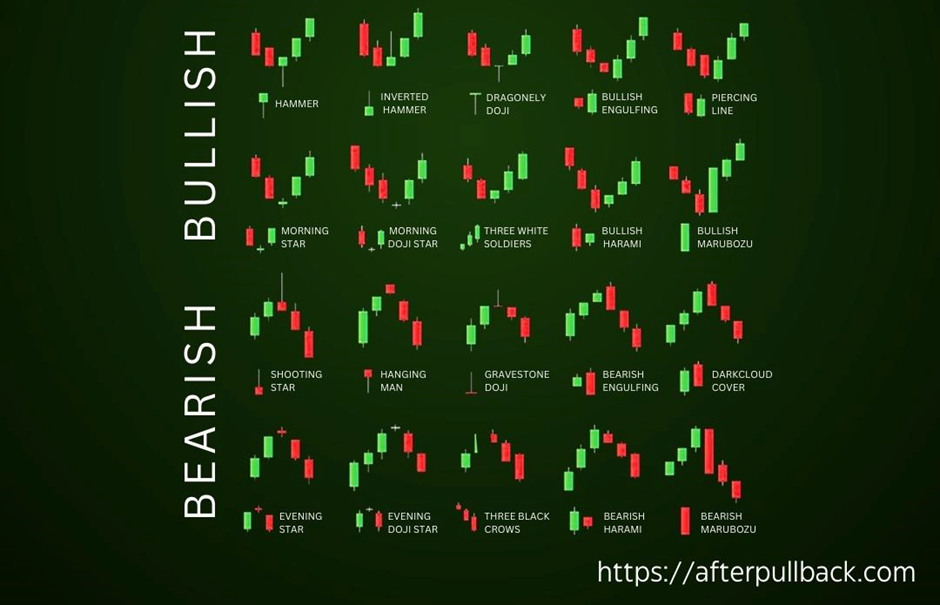
- Price Action: Don't simply enter a trade solely because the price reaches a pivot point. Look for bullish price action signals at the pullback low, indicating a potential resumption of the uptrend. Bullish reversal candlestick patterns like hammers, engulfing bars, or pin bars can be good indicators.
- Volume Confirmation: Increased volume on bullish candlesticks adds credence to the reversal signal. Higher volume suggests more buying interest coming into the market, potentially pushing prices higher.
- Two Candle Rule (Optional): While not mandatory, consider using the "two-candle rule" as a filter. Look for two consecutive bullish candlesticks after the pullback low. This provides additional confirmation that the uptrend might be resuming.
So,
You have identified the uptrend, and recognised the pullback but and now is the time to enter the trade.
But how do you know when to enter the trade?
To take this decision, We have a quote from one experienced trader,
“Don't trade in isolation!”
Observe how the price behaves at the pullback low, near potential support zones. Look for bullish price action signals that suggest a potential reversal and continuation of the uptrend:
What kind of Bullish Reversal Candlestick Patterns?
These patterns, like hammers, engulfing bars, or pin bars, often appear at the bottom of pullbacks and indicate a potential shift in buying and selling pressure.
Hammers: A small body with a long lower wick, suggesting buyers stepped in to defend the support level.
Engulfing Bars: A bullish engulfing bar completely engulfs the previous bearish candlestick, signifying a strong buying reversal.
Pin Bars: A long wick on either the top or bottom of the candle with a small body, indicating rejection at the current price level.
Pro Tip: Ideally, the bullish candlestick should close above the support zone or the previous day's low. This reinforces the buying pressure and potential trend resumption.
Here is another thing,
Although the Price action provides valuable insights, but volume adds another layer of confirmation.
So,
You have to look for a surge in volume accompanying the bullish candlestick pattern. This will suggest more buying activity behind the price move, potentially indicating a stronger reversal and continuation of the uptrend.
On the other hand,
Low volume on bullish candlesticks can be a sign of weakness. The price movement might lack conviction, and the uptrend might not be sustainable.
The Secret Two-Candle Rule (Optional Filter)
Do you know what most experienced traders do?
They use the "two-candle rule" as an additional filter:
How do they do it ?
They look for Two Consecutive Bullish Candles in a trend after the pullback!
After the pullback low and potential support zone, look for two consecutive bullish candlesticks closing above the previous day's high. This reinforces the initial bullish signal and suggests a stronger uptrend continuation.
Step 5: Entry and Stop-Loss Placement
Key Takeaway for Step 5:
You enter a trade after a pullback within the uptrend. This offers a potentially better entry price compared to the initial high.
If, after the pullback, you can place a stop-loss with at least one ATR distance below your new entry price, you'll consider the trade.
Crucially, this one-ATR stop-loss placement must also fall below a pivot point support zone. This ensures your stop-loss is well-protected within the overall uptrend structure.
If the one-ATR distance after a pullback falls above the pivot point, you would likely avoid the trade. This maintains your disciplined approach to stop-loss placement.
Alright, So,
Having identified a promising pullback within an uptrend, a bullish reversal signal, and a potential support zone, it's time to determine your entry and stop-loss placement for your strategy.
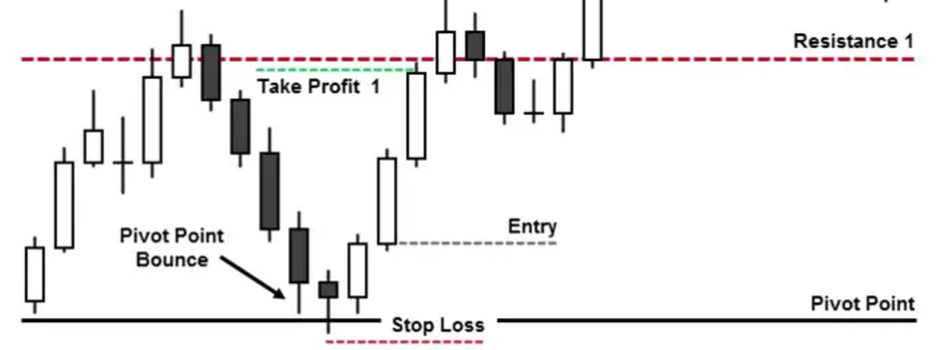
For more experienced traders, A Common approach is to place your entry order slightly above the pullback low. This allows for some breathing room in case the price dips slightly before reversing upwards. However, entering too close to the low can expose you to the risk of getting stopped out if the pullback extends further.
A more conservative approach is to position your entry order above the high of the bullish confirmation candlestick. This ensures you enter the trade only after a confirmed reversal and limits the risk of entering a false breakout.
Some traders prefer additional confirmation before entry. They might use trailing stop-loss orders or wait for a break above a short-term moving average at the pullback low.
Here is another point as well !
More aggressive traders might opt for a tighter entry near the pullback low, while risk-averse traders might prefer the safety of entering above the confirmation candle high.
Stop-Loss Placement:
The stop-loss is a crucial risk management tool that limits your potential losses if the trade moves against you. If you are using ATR for your stop-loss placement,
The Most Common Approach is 1x ATR!
We use ATR because for many traders, its a better method of stop loss placement.
So,
A widely used approach is to place your stop-loss at least 1 ATR below your entry price. This distance considers the average price range and offers some buffer for potential retracements within the uptrend.
But for our Strategy, We utilize a combination of Average True Range (ATR) and pivot points to create a dynamic and adaptable approach within our strategy.
Here's how you do it:
Step Number 1 is Standard Practice. You prioritize placing your stop-loss at least one ATR ( or 2x or 3x ATR depending on your risk tolerance) distance below your entry point in an uptrend. This initial buffer zone helps absorb normal price fluctuations within the uptrend without getting stopped out prematurely.
However, In Step Number 2, you add an extra layer of protection by ensuring this ATR distance also falls below a pivot point support zone. Pivot points, calculated based on the previous day's trading range, can indicate potential support areas.
If the minimum one-ATR distance falls above the pivot point (i.e., closer to the entry price), you might forgo the trade altogether. These stricter criteria helps you avoid entering trades where the initial stop-loss placement might be too tight within the uptrend.
Did you see the benefits?
See, The combination of ATR and pivot points helps you establish a stop-loss that considers both volatility and potential support zones. The strategy also allows for potential entry on pullbacks while maintaining a minimum ATR buffer and pivot point confirmation for the stop-loss.The strict adherence to keeping the stop-loss below the pivot point promotes disciplined risk management.
Multi-Layered Stop-Loss Protection
Did you notice one particular thing in this strategy?
Our Stop Loss is protected by three layers!
Layer 1: Leveraging the Trends
We placed our stop loss when we were sure that we are in an uptrend and
Uptrends Favor Higher Prices.
The core principle behind this layer is the inherent characteristic of uptrends. Statistically, the probability of the price moving higher is greater during an uptrend.
By placing your stop-loss below a key support level within the uptrend (identified through technical analysis or price action), you create a buffer zone. This buffer helps absorb potential price fluctuations that wouldn't necessarily signal a trend reversal.
Layer 2: ATR
The ATR remains a crucial component in your stop-loss strategy. As It provides an objective measure of average price range (volatility) in the market you're trading, so , by incorporating ATR, you can dynamically adjust your stop-loss as market volatility changes. This helps prevent getting stopped out due to normal price fluctuations within the uptrend.
Layer 3: Pivot Points
Pivot points, calculated based on the previous day's trading range, can identify potential support and resistance zones.
So, By introducing pivot points in your strategy, you are adding additional confirmation for placing your stop-loss within the uptrend. Ideally, your stop-loss would be nestled between a support level identified through technical analysis and a pivot point support zone, offering an extra layer of protection.
What the benefit of this three layered approach?
See, By strategically combining these layers, you create a more robust stop-loss strategy within the 3-ATR framework. The uptrend and pivot points provide a directional filter, while ATR adds volatility-based protection. This multi-layered approach can help you stay in winning trades longer while limiting potential losses during pullbacks within the uptrend.
Step 6: Taking Profits in Steps
Key Takeaway for Step 6
Key Idea: Secure gains using ATR while staying flexible for trends.
- Stop-Loss Buffer: Think of the 1 ATR buffer in your stop-loss as a trading cost. Winning trades above entry "pay it back."
- 3-Tier Profit Taking:
- TP1 (Secure Base): Take 33% profit at 2 ATRs above entry (1 ATR "pays back" stop-loss, 1 ATR is profit).
- TP2 (Trend Target): Take another 33% profit at 3 ATRs for potential trend continuation.
- TP3 (Ride the Trend): Leave 33% open to potentially capture even larger profits in extended trends.
So,
now comes the crucial step,
Where you take profits.
For the strategy of taking profits, we leverage the Average True Range (ATR) indicator to strategically place multiple profit targets (TPs), helping you lock in gains while allowing flexibility for potential trend continuation. Here's a breakdown of this 3-tier profit-taking approach, considering your unique stop-loss placement strategy:
Understanding Stop-Loss Placement:
Your preferred stop-loss strategy positions the stop-loss at least one ATR below your entry point ( or 2x or 3x ATR depending on your risk tolerance and asset volatility), ideally nestled under a pivot point support zone. This placement plays a crucial role in determining your profit targets.
But Why this 1 ATR Profit Buffer?
You may ask.
See, Most experienced traders view the initial one-ATR buffer in the stop-loss placement as a necessary "business expense" in trading.
Let us explain,
You know that Inherent losses from trades where the price falls and triggers the stop-loss are part of the game. So, When a winning trade moves at least one ATR above your entry price, it essentially "pays back" this stop-loss expense. This one ATR buffer serves as a buffer zone to absorb minor fluctuations before potential profit-taking.
Profit-Taking Strategy:
So, if your Stop Loss was 1 ATR below the entry price below is the recommended approach to profit-taking:
TP1: Secure Base Profits (2 ATRs above Entry):
Due to the one-ATR stop-loss buffer, your initial profit target (TP1) is shifted to at least two ATRs above your entry price. This ensures you capture profits beyond the stop-loss buffer zone.
This will effectively mean that the first ATR will cover your “business expenses” as explained above and the next ATR will become your profit.
So, If you can take double the ATR as profit, This will become your Take Profit 1 (TP1) Level
Here, you take 33% of your profits. This secures some gains and offsets potential trading commissions.
TP2: Target Potential Trend Extensions (3 ATRs above Entry):
The second take profit level is set at 2 ATRs above your entry point. By taking another 33% of your profits here, you capitalize on potential trend continuation beyond the initial price move. This target aims to capture a larger portion of the uptrend if the price keeps rising.
TP3: Ride the Trend (Remaining Position):
The remaining 33% of your position is left open, allowing you to potentially benefit from significant trends. This portion functions like a trailing stop-loss, potentially capturing even larger profits if the uptrend extends considerably.
The Rationale Behind 3 ATRs:
Through backtesting on various charts, it was observed that 3 consecutive ATRs often represent a substantial price movement in uptrends. This distance serves as a benchmark for placing your profit targets, helping you capture a significant portion of the trend while also managing risk.
Remember: This 33%/33%/33% profit-taking allocation is a common suggestion, but you can adjust it based on your risk tolerance and trading style. The key is to have a predefined profit-taking strategy to secure gains while leaving room for potential trend continuation.
Role of Psychology in this trading strategy
Now here is an interesting situation
Remember we placed our stop loss 1 ATR below the entry point, provided it was under a pivot as well ?
But,
what most beginner traders do is that they fail to respect this stop-loss placement due to fear of loosing out. They often moving it further below the 1 ATR level hoping to avoid getting stopped out.
But be aware,
This approach can lead to a vicious cycle. A wider stop-loss might be missed in a winning trade, meaning they will avoid the loss this time.
But,
When in a losing trade, this wider stop-loss gets triggered, It will cause a bigger loss. This will prompt them to place even wider stop-loss placements in subsequent trades, potentially leading to larger losses.
So,
The Key is to
Respect Your Stop-Loss
By placing your stop-loss one ATR below the entry point (ideally under a pivot point in an uptrend), you accept a potential loss in the initial trade. However, this disciplined approach minimizes potential losses and allows for a quicker recovery when the trend continues in your favor.
In Essence,
Respecting your stop-loss, even if it gets triggered initially, protects your capital and allows you to stay in the game for potentially profitable trends. Remember, a small loss managed well is better than a large loss due to undisciplined stop-loss placement.
In Conclusion
This strategy provides you a framework for entry, stop-loss placement, and profit-taking. By incorporating Average True Range (ATR) and pivot points, you can identify trends, manage risk, and strategically lock in gains.
Trade Smarter!


