How to Manage Risks and Rewards ratio in Trending Markets

Do you also have those friends who seem to have stumbled into good fortune?
You know the type - the one who throws a dart at the stock market blindfolded and somehow ends up winning?
If not you, maybe someone in your circle may have heard about the stories of people who somehow once overheard some colleagues talking about a "hot tech stock" and decided to throw a few hundred bucks at it purely on a whim. No research, no strategy, just pure, unadulterated luck.
But to their Luck, the stock skyrocketed, and they ended up tripling their money.
Now, don't get us wrong, People get Lucky sometimes, but relying solely on chance in trading is a recipe for disaster.
That's where the concept of Risk-Reward Ratio (RRR) comes in.
You see, Trading is not about blind luck, it's about calculated risk-taking. It's the difference between a lucky one-time win and a sustainable trading strategy.
With a solid RRR strategy, you can approach every trade with a clear understanding of the potential upside and the downside risk.
This blog post will discuss RRR, explaining how to calculate it and how to use it in trending markets.
Understanding Risk-Reward Ratio
To understand the concept of Risk and Rewards ratio, Let's take an example,
Let's say you discover a penny stock named "MicroTech Inc." (ticker symbol: MTEK) trading at a mere $0.20 per share. Penny stocks are known for their high volatility and potential for explosive gains, but also significant risk. (Does the Film Wolf of Wallstreet ring a bell? )

Intrigued by the possibility of substantial profits, you decide to research a little more.
Your research reveals that MTEK is a young company with a developing product in a competitive market. Financial news sources report mixed reviews, with some analysts cautiously optimistic and others expressing concerns about the company's ability to turn a profit. Despite the uncertainty, the potential for a significant return is undeniable.
Envisioning a surge in MTEK's price, you decide to purchase 1,000 shares for a total investment of $200 (1,000 shares * $0.20 per share). However, you also recognize the inherent risk in penny stocks. To limit potential losses, you place a stop-loss order at $0.15 per share.
Here's where the RRR comes into play
The Risk-Reward Ratio (RRR) is a fundamental metric used in trading to compare the potential profit you can make on a trade with the potential loss you're willing to accept. It essentially expresses the relationship between the risk and the reward involved in a particular trade setup.
So, In this scenario:
Potential Profit would be the difference between your target price and your entry price. Since you haven't set a specific target price, let's assume you'd be happy with a modest 50% gain, targeting a price of $0.30 per share. (Target price of $0.30 - Entry price of $0.20 = $0.10 potential profit).
And
your Potential Loss will be difference between your entry price and your stop-loss price. (Entry price of $0.20 - Stop-loss price of $0.15 = $0.05 potential loss)
Now, let's calculate the RRR:
RRR = Potential Profit / Potential Loss
RRR = $0.10 / $0.05 = 2:1
At first glance, a 2:1 RRR might seem acceptable. However,
there's a thing to consider here.
Penny stocks are notoriously volatile. The price could easily plummet below your stop-loss, potentially resulting in a larger loss than anticipated.
Here's why a 2:1 RRR might not be ideal in this scenario:
While a 50% gain is desirable, the potential downside is significant. A small negative swing in the price could easily trigger your stop-loss and wipe out a large portion of your investment.
Also,
Penny stocks are known for their wild price swings. The price might not reach your target of $0.30 before dropping below your stop-loss, leaving you with a loss despite aiming for a modest gain.
Did You See?
By understanding RRR and recognizing a potentially unfavorable risk-reward scenario, you can make more informed trading decisions.
and these informed decisions may make you;
Increase your Stop-Loss Price: This would decrease your potential profit but also reduce your potential loss, improving the RRR.
Reduce your Position Size: Invest a smaller amount in MTEK to limit your overall risk exposure.
Seek a Different Opportunity: Explore trades with established companies and a more predictable price movement, potentially offering a better risk-reward profile.
Can You Squeeze More Profit from Trends?
Absolutely Yes!
As we discussed in our last blog, How to Identify Trends, Trending markets present an exciting opportunity for traders. Prices exhibit a clear directional bias, potentially leading to larger gains compared to choppy, ranging markets.
Here is when it gets interesting!
This predictability of trending markets allows you to explore the possibility of targeting higher RRRs beyond the basic 2:1.
But how do you identify these trends and assess their strength?
Lets Recap briefly
To Identify a strong Trend,
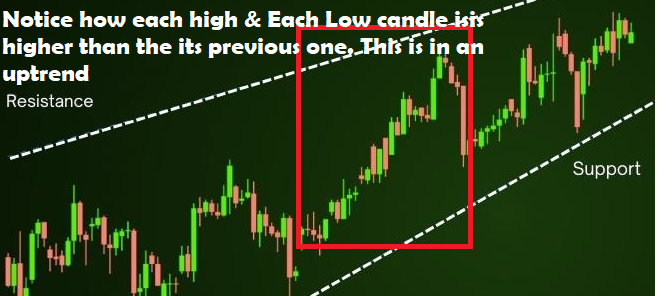
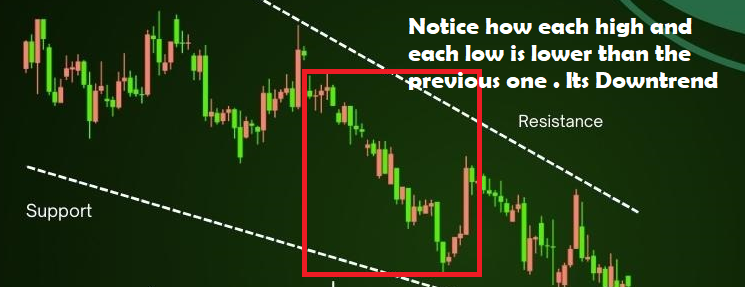
You look for Price Action Consistency. Look for a series of higher highs (uptrend) or lower lows (downtrend) with minimal pullbacks. This consistency suggests a dominant directional force driving the price.
Make use of Moving Averages. These trend-following indicators help smooth out price fluctuations and reveal the underlying trend direction. A rising or falling moving average with increasing separation from the price indicates a strong trend.
Similarly,
Drawing trendlines along the highs (uptrend) or lows (downtrend) helps visualize the trend's direction and potential continuation. A trend with a well-defined, unbroken trendline suggests strength.
Indicators like RSI or MACD can help gauge the trend's momentum. Rising values in uptrends and falling values in downtrends with strong confirmation signals a trend with significant driving force.
As a result,
With a strong trend identified, you can explore RRRs beyond the basic 2:1
3:1 or Even 4:1!

These RRRs can be viable options in powerful trends with well-defined entry points and supportive technical indicators.
But Remember, this strategy requires stricter risk management practices due to the increased potential reward also translating to increased potential risk.
Support and resistance zones become even more critical in trending markets.
For an Uptrend Entry, Identify potential entry points near support zones. A successful bounce off support often signals a continuation of the uptrend. This allows you to place your stop-loss below the support and target your profit further up the trendline, potentially achieving a higher RRR.
Similarly,
For Downtrend Entry, Look for potential entry points near resistance zones in downtrends. A break below resistance suggests a continuation of the downtrend. Place your stop-loss above the resistance level and target your profit further down the trendline, maximizing your RRR potential.
Ready. Set. Trend! How to Build Your RRR-Powered Trade Setup?
Now, that you have an idea of how to identify the trends and how to set entry and exit, Here's a step-by-step process to build a trade setup using risk reward ratio in a trending market:
Step 1: Define Your Stop-Loss
The Setup begins by Knowing Your Risk Tolerance first. This is the foundation. How much capital are you willing to risk on a single trade? A higher risk tolerance allows for a wider stop-loss, potentially leading to a higher RRR. However, never risk more than you can afford to lose.
And take a note that,
Volatility Matters!
You can use the Average True Range (ATR) indicator to understand the typical price movement of the security you're trading. Setting your stop-loss at least 2 ATR away from your entry point provides a buffer against normal market fluctuations and helps you avoid getting shaken out by temporary price swings.
If you need help in setting Stop Loss using ATR, Our Blog How to Calculate Stop Loss Using an ATR Indicator will be very helpful
Step 2: Identify Potential Profit Target
Here's where your understanding of the trend and technical analysis comes into play:
To identify potential profit targets, Work on your Trendline Projection. Extend the trendline on your chart to estimate where the price might reach if the trend continues. This projected price level can be a potential profit target.
In uptrends, look for potential profit targets near the next support zone. A successful bounce off support often signifies a continuation of the uptrend. Conversely, in downtrends, identify potential profit targets near resistance zones where a break below suggests further downside potential.
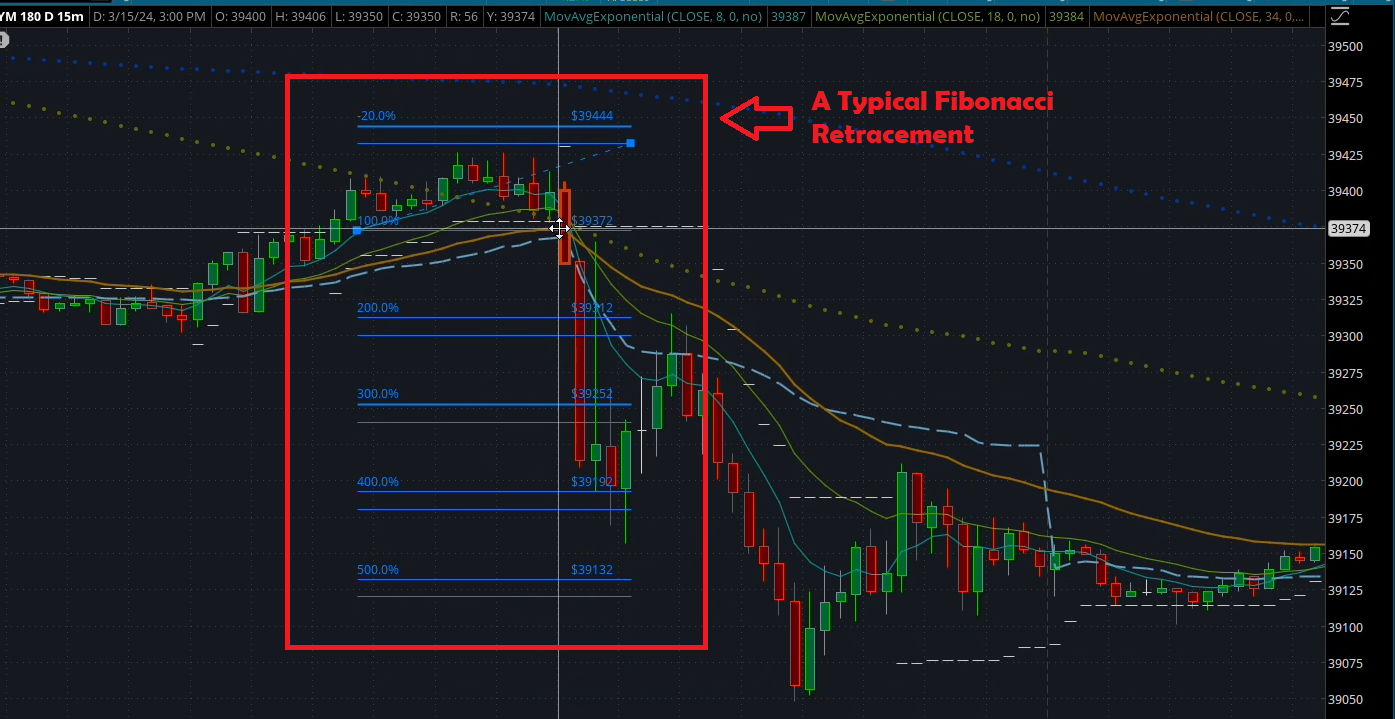
You can also Apply Fibonacci retracement levels to the recent trend move. These levels can act as potential support or resistance zones, highlighting areas where the price might stall or reverse, offering profit-taking opportunities.
Step 3: Calculate and Optimize Your Risk Reward ratio
Once you have your stop-loss distance and potential profit target, simply divide the profit target by the stop-loss distance. This will give you your RRR.
Remember
While a minimum 2:1 RRR is a good starting point, trending markets might allow for a higher ratio (e.g., 3:1 or even 4:1) if your risk management practices are sound and the trend is well-established.
Conversely,
In volatile markets, consider a slightly lower RRR (e.g., 1.5:1) to account for the increased risk of unexpected price swings.
Step 4: Don’t Forget Risk Management
Even with a good RRR, risk management is crucial
Only allocate a small percentage of your capital (e.g., 1-2%) per trade to avoid risking too much on a single trade.
Another important point to remember is that markets are dynamic.
Don't Just set Risk Reward ratio and forget it.
Monitor your trade actively and be prepared to adjust your stop-loss or exit the trade if the market conditions change or the trend weakens.
Before risking real capital, backtest your entry and exit strategies with historical data to see how they perform in different market conditions and with various RRRs.
Additional Tips
And we are not done yet!
Here are some additional tips that may benefit you in the long run.
Practice Patience: Trading success doesn't happen overnight. Be patient, hone your skills through practice (using paper trading or a simulator), and learn from your mistakes. There will be wins and losses, but the key is to learn and adapt your approach over time.
Beware of Emotions: Fear and greed are powerful emotions that can cloud your judgment. Maintain a level head and stick to your trading plan to avoid making impulsive decisions based on emotions.
Focus on the Process, Not Just the Outcome: While achieving profitable trades is the ultimate goal, focus on following your trading plan and making sound decisions based on your analysis. Don't get discouraged by losses; instead, analyze them and learn from them to improve your future trades.
Never Stop Learning: The financial markets are complex and ever-changing. There's always new knowledge to be gained. Continuously seek out educational resources, attend webinars, and learn from experienced traders to stay ahead of the curve.
Conclusion
By incorporating the concepts explored in this blog – understanding risk-reward, identifying trends, and employing strategic entry and exit points – you can equip yourself with valuable tools for navigating trending markets. Remember, risk management is paramount, and a disciplined approach is key to achieving sustainable success in the world of trading.
Trade Smarter!


