How to make a Winning Strategy out of Breakout Trading?
You might have heard about "Breakout Trading" in your trading circles and may be wondering what exactly this strategy is and why most traders seem to profit from it.
Well,
Same as in a breakout from jail, people are escaping confinement, similarly, in breakout trading, the price breaks free from a defined range or pattern.
Confused?
Don't worry, in the blog post below, we have explained everything about breakout trading in detail.
Let's go,
What is Breakout trading?
Breakout trading is one of the many trading Strategies used by traders to capitalize on potential price movements when an asset's price breaks through a specific level. This level is typically a support or resistance level that has been established over time on a price chart.
A breakout suggests a shift in the balance between supply and demand for the asset.
If the price breaks above resistance, it might signal a potential trend reversal to the upside, attracting buyers who believe the price will continue to rise.
Conversely,
a break below support could indicate a potential downside trend, prompting traders to short the asset (essentially betting on its price to fall).
These Breakouts are particularly beneficial for traders
Breakouts can signal the beginning of strong trends, offering opportunities for significant profits if the trade moves in the anticipated direction.
How to Identify Strong Breakouts?
Experienced traders identify the breakouts employing two methods;
Identifying Breakouts through Support and Resistance Level
The cornerstone of breakout trading is identifying high-quality support and resistance zones. These zones act as price boundaries that the asset has struggled to breach in the past.
To identify these support and resistance levels, you need to look for
Price Action
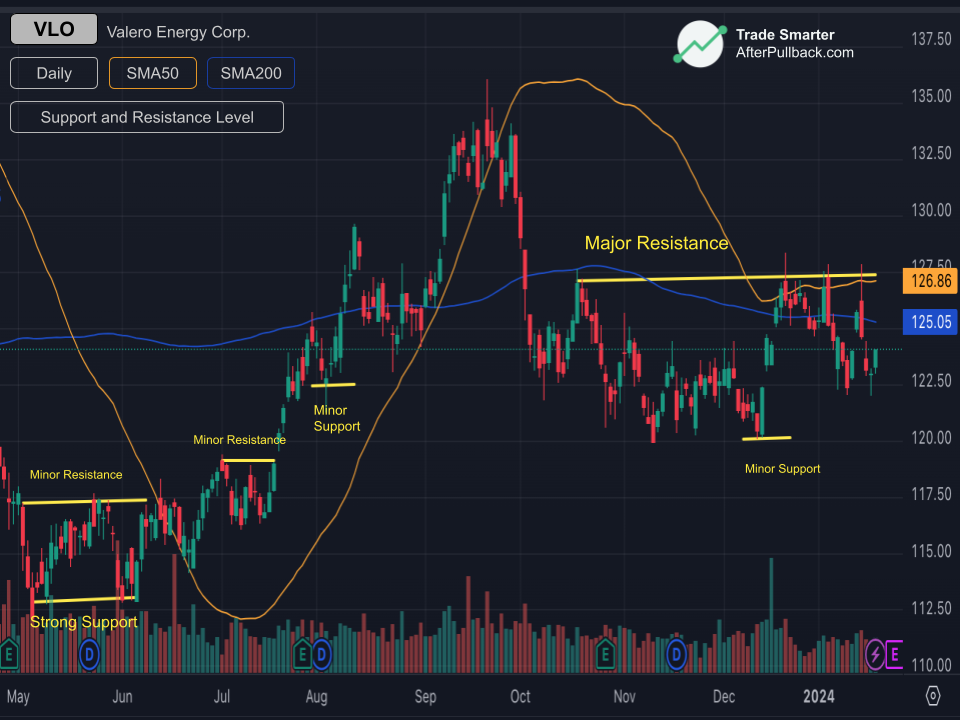
Look for areas on the chart where the price has repeatedly found buyers (support) or sellers (resistance), causing it to bounce off those levels. This price congestion creates visible horizontal bands on the chart.
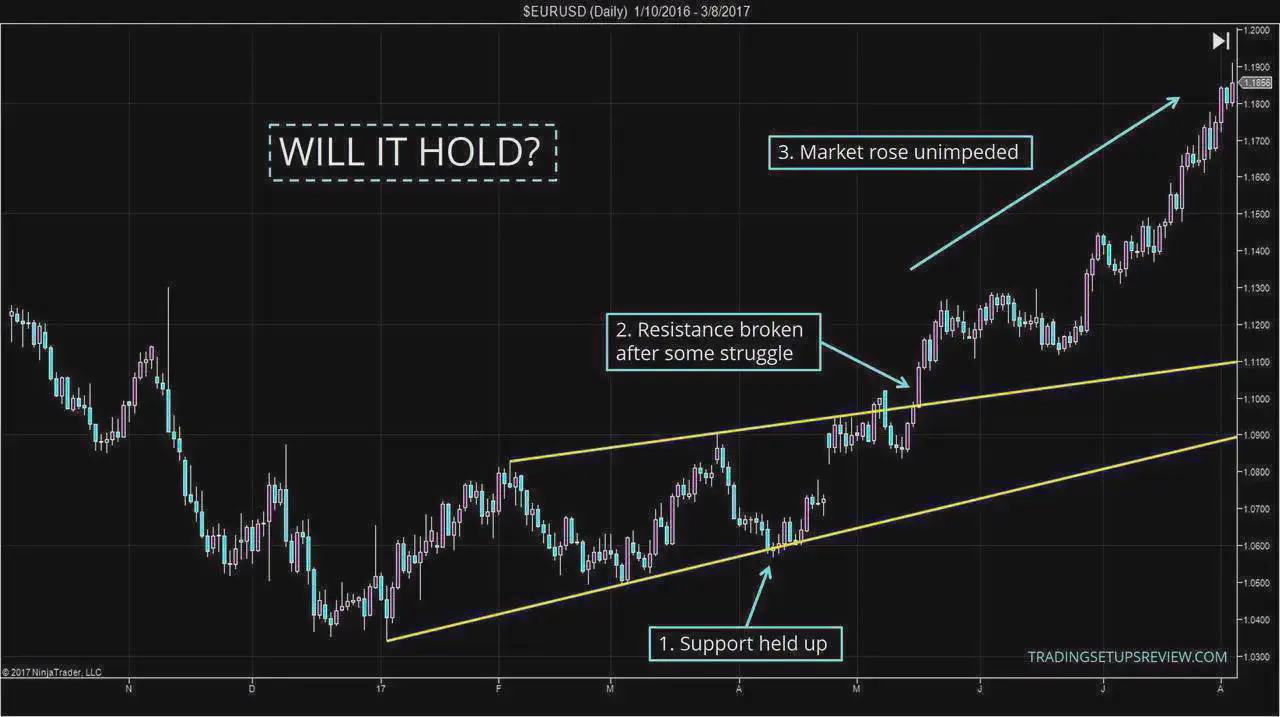
Once these areas are identified, Draw trendlines along the highs (uptrend) or lows (downtrend) of the price movement to identify potential support/resistance zones. A break above an uptrend line or below a downtrend line could signal a breakout.
You can also use some technical Indicators like Moving Averages for this. Moving averages smooth out price fluctuations and can highlight support and resistance zones. Areas where the price consistently finds support around the moving average (e.g., 50-day or 200-day moving average) can be potential breakout zones.
But,
Why do Low-volumeWell-Defined and Tested Levels Matter?
You see,
The strength of a breakout heavily relies on the quality of the support/resistance zone.
Clear price congestions or trendlines leave less room for misinterpretation, allowing for a more confident identification of the breakout point.
These levels represent areas where significant buying or selling pressure has occurred previously. A breakout suggests this pressure might be overcome, leading to a larger price movement.
The more times the price has tested a support/resistance level and bounced off it, the stronger the barrier becomes. This repeated testing suggests a higher chance of a sustained breakout if finally breached.
Breakout Confirmation through Volume Confirmation
Volume plays a vital role in confirming the legitimacy of a breakout.
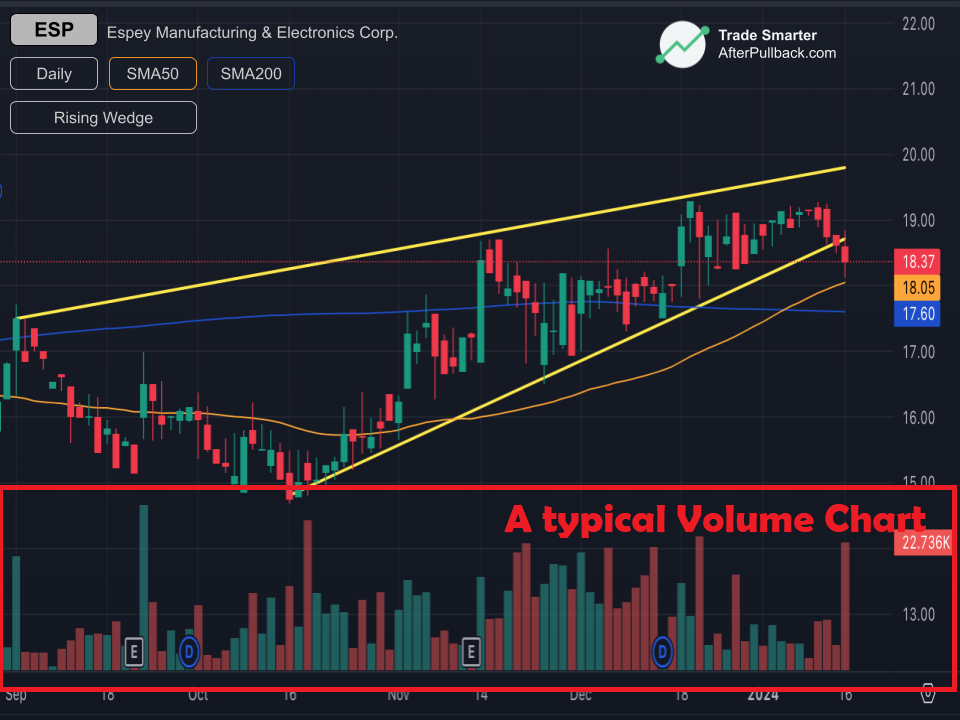
A surge in trading volume alongside the price move through support/resistance suggests increased buying or selling pressure behind the breakout. This signifies stronger conviction from market participants, potentially leading to a more sustained trend.
Further,
A sudden spike in volume on the breakout bar is ideal, indicating a concentrated effort to push the price through the level. However, a steady increase in volume leading up to and during the breakout can also be a positive sign.
Why Volume Matters:
Volume represents the actual number of shares or contracts traded. Higher volume signifies more interest in the asset, which can fuel the price move further in the breakout direction. Low-volume breakouts might be more susceptible to false reversals as there's less force behind the price movement.
What to do once you have identified a Potential Breakout?
Now,
If you have identified a breakout through the Support/resistance level, the Next question will be
How to enter A trade during a Breakout?
Although a price action scanner can spot the entry signals, But, If you don’t have one, then the the simplest approach for this will be
Entering at the Breakout Point
This is a straightforward approach where you enter a long position (buy) immediately after the price decisively closes above resistance or a short position (sell) after it closes below support.
This approach has a particular Advantage, You capture the initial move of the breakout if the price continues in the anticipated direction.
But there is a disadvantage to this approach as well. This approach exposes you to potential whipsaws or false breakouts, where the price might pierce the level but then reverse quickly.
One possible solution for this will be to
Use Trailing Stops
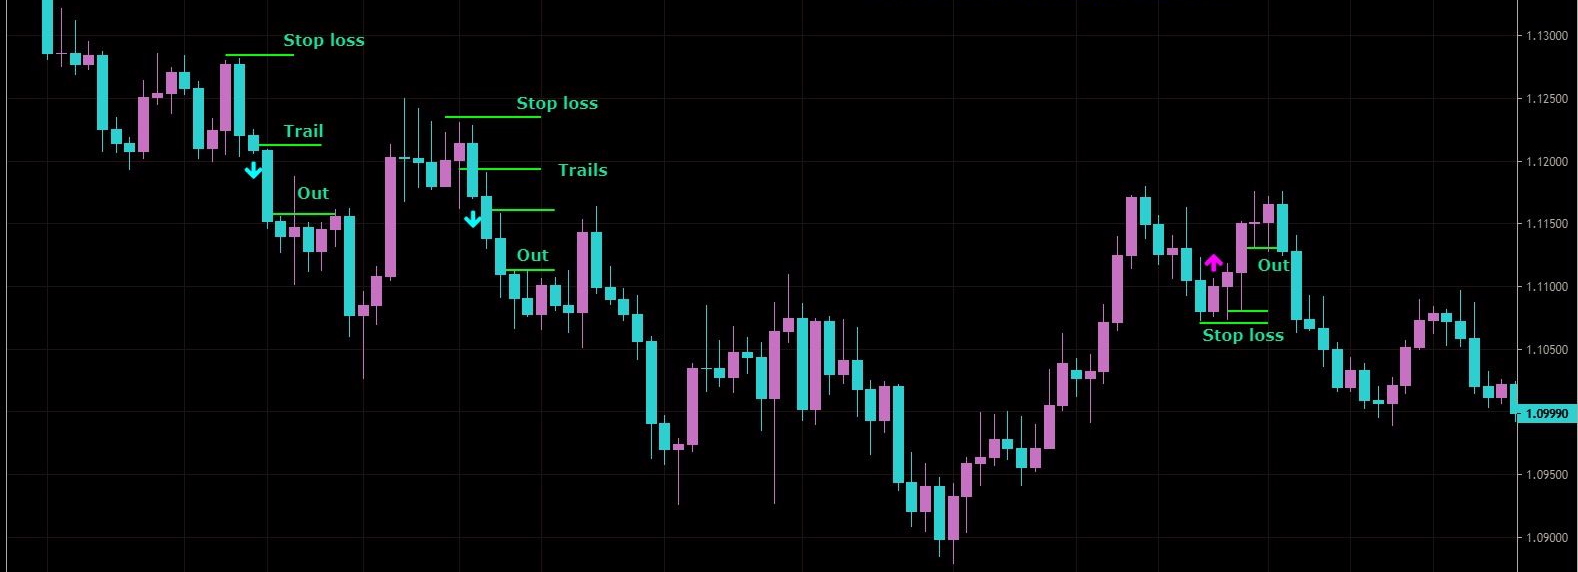
A trailing stop is an order that automatically adjusts itself as the price moves favorably.
With a long breakout trade, you place a trailing stop-loss order below the price, which trails upwards as the price rises. This locks in profits while allowing the trade to run if the trend continues.
Conversely,
for a short breakout trade, you place a trailing stop-loss above the price, which trails downwards as the price falls.
The Advantage? Trailing stops help lock in profits and mitigate losses if the price movement stalls or reverses.
But the Disadvantage is, that you might miss out on some profits if the trailing stop gets triggered prematurely during a volatile price move.
Another Strategy Can be
Placing Pending Orders above Resistance (Long) or Below Support (Short):
This method involves placing buy orders (for long trades) slightly above resistance or sell orders (for short trades) slightly below support. These are pending orders that will only be triggered if the price breaks through the designated level.
This approach helps avoid entering a false breakout and improves entry precision. You only enter the trade if the breakout is confirmed.
But a slight disadvantage will be that You might miss the initial breakout move if your order placement is too far above/below the support/resistance level.
So, How to Choose the Right Entry Strategy?
Well,
The choice of entry strategy depends on your risk tolerance and trading style.
If you are an Aggressive trader, Entering at the breakout point might be suitable, but proper risk management with stop-loss orders is crucial.
On the Other hand,
If you are a Conservative trader, Placing pending orders can help confirm the breakout and avoid whipsaws, but there's a risk of missing the initial move.
A good middle ground can be Trailing stops, offering some profit protection while allowing the trade to run if the trend continues.
How to Take Profit during a Breakout?
Just as there are various entry strategies for breakout trades, there are also different approaches to setting profit targets.
Although many experienced traders use ATR as a method of taking profit, One of the simplest methods is to take
Fixed Profit Targets:
This method involves setting a pre-determined profit target for your trade, expressed as a price level or a percentage gain from your entry price.
The Advantage of this approach lies in its Simplicity - Easy to implement and understand. Also, It encourages taking profits and avoiding the greed of holding for potentially larger gains.
But the drawback is, that Fixed Profit Target might leave profits on the table if the breakout leads to a strong sustained trend. It also Doesn't account for changing market conditions.
So, How to Set Fixed Targets?
Well, The easiest approach will be to set it based on
Historical Volatility
Analyze the asset's historical price movements and identify its average daily range (ADR) or average true range (ATR). These indicators represent the asset's typical price fluctuation. You can set your target based on a multiple of the ADR/ATR from your entry price.
You can also set
Percentage Gains. Set a fixed percentage gain from your entry price as your profit target. This approach is easier to implement but might not account for the potential of the breakout move.
Another Common Approach to define Profit Targets is through
Take profits using Technical Indicators
You see,
Technical indicators can provide objective insights for potential profit targets based on historical price patterns.
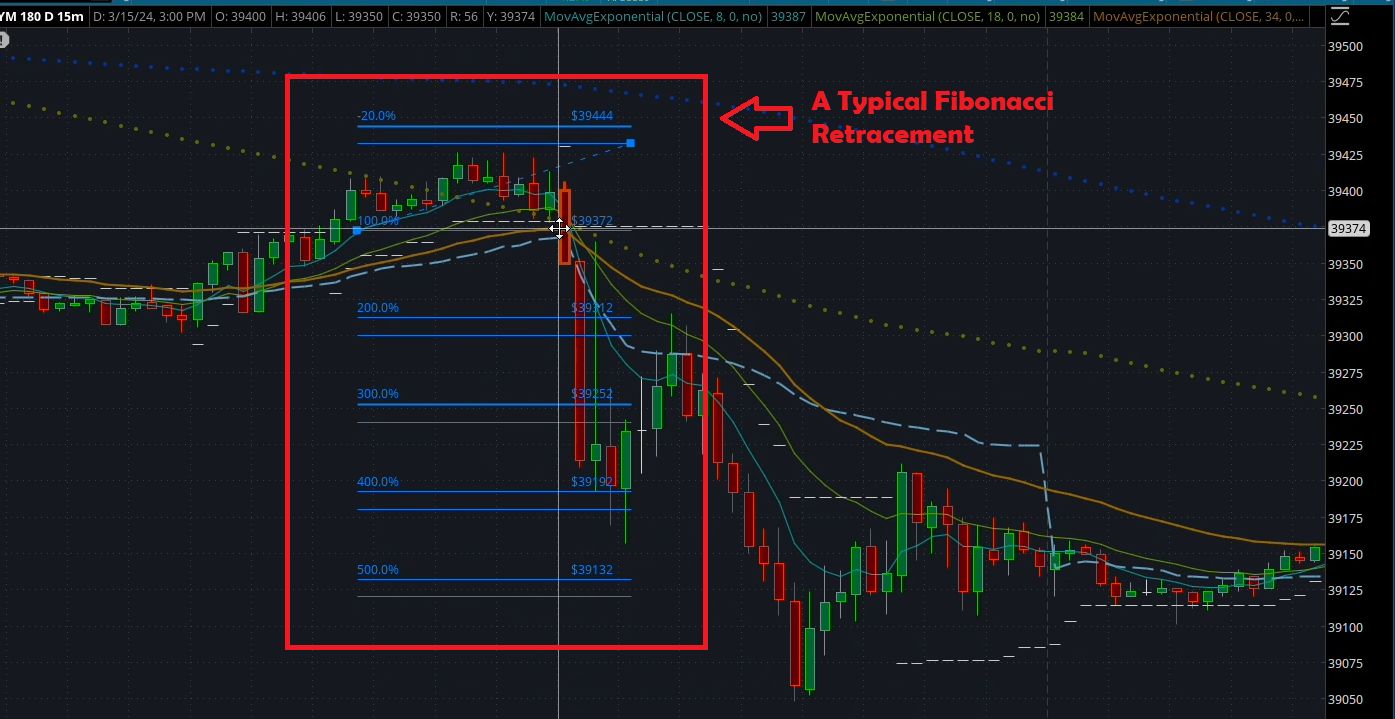
Indicators like Fibonacci Retracements are lines drawn on a price chart based on historical highs and lows. These lines represent potential support levels where the price might retrace after a breakout before continuing its upward trend. Traders can set their profit target at a Fibonacci retracement level they believe the price might reach during a pullback.
You can also use Support and Resistance to mark the Proft Targets. After a breakout, former support levels can become new resistance zones. Traders can set their profit target at these former support levels, anticipating the price might encounter selling pressure at those points.
The Advantage of this approach is that it offers objective guidance based on historical patterns. This can help identify potential reversal points within the breakout trend.
Trailing Take Profit Orders:
Similar to trailing stop-loss orders, you can set trailing take profit orders that automatically adjust upwards (for long trades) or downwards (for short trades) as the price moves in your favor.
As with Trailing Loss, This helps lock in profits as the trend progresses & Also offers some flexibility compared to fixed profit targets.
But the Disadvantage is, that You might miss out on some profits if the price sharply reverses before the trailing take profit is triggered.
How to Identify and Avoid False Breakouts?
Breakouts are exciting but,
In you trading journey, you may encounter instances where the price might pierce a support/resistance level, triggering buying or selling pressure, but then quickly reverse course. These are known as false breakouts and can lead to significant losses if you're not careful.
So, How do you identify these false breakouts?
The First sign is
Low Volume
While strong breakouts are often accompanied by a surge in volume, false breakouts might see lower trading activity. This suggests a lack of conviction behind the price move, and the breakout might fizzle out quickly.
False Breakouts often have Weak Close. You might see the price pierce the support/resistance level but then struggle to close definitively above (for resistance) or below (for support) on a daily or higher timeframe candle. This indecision can indicate a lack of follow-through buying or selling pressure.
Similarly,
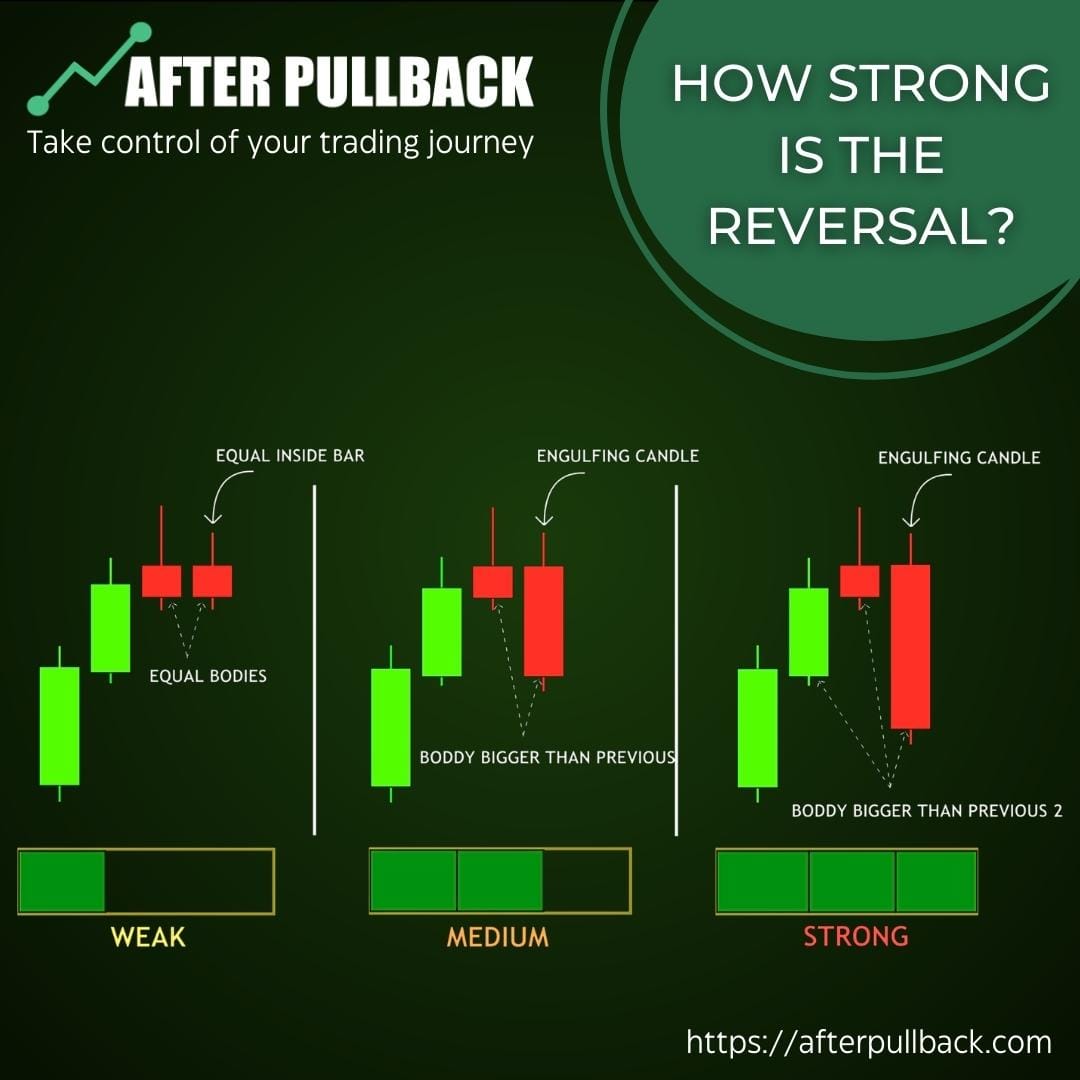
Price action reversal candlestick patterns like pin bars with long wicks or engulfing bars where the body of the current candle completely engulfs the previous candle's body, appearing shortly after the breakout, can signal a potential reversal.
So,
How can you Avoid these False Breakouts?
First up, Look for Confirmation with Volume.
Look for a significant increase in volume alongside the price breaking the support/resistance level. This signifies stronger conviction behind the move and reduces the chance of a false breakout.
And
Wait for a Retest
Sometimes, a genuine breakout will see the price briefly revisit the broken support/resistance level before continuing its trend. This retest can act as a confirmation of the breakout and an opportunity to enter the trade with more confidence. The point sufficiently explained in our blog Pullback Trading Strategies: What are they and how to use them to your advantage
And
Always place stop-loss orders below your entry point for long trades and above for short trades. This helps limit potential losses if the breakout turns out to be false.
Experienced traders also look for
Price Confirmation After Breakout
See, You Don't need to jump in immediately after the price pierces the support/resistance level.
Wait for a confirmation candle to close definitively above resistance (for long trades) or below support (for short trades). This confirmation can be a strong close (large body candle) or a price move beyond a specific distance above/below the level.
Waiting for confirmation also reduces the risk of entering a false breakout where the price quickly reverses after breaching the level.
Another thing that can be employed is
Placing Pending Orders with a Buffer:
Instead of entering a market order at the breakout point, consider using pending orders with a small buffer above resistance (for long trades) or below support (for short trades).
This buffer acts as a safety net in case the breakout turns out to be false.
The buffer amount should be strategically chosen. It shouldn't be too large to miss the initial breakout move if it's genuine, but big enough to avoid getting caught in minor price fluctuations that might precede a reversal.
Combine breakouts with other technical indicators like moving averages, relative strength index (RSI), or Bollinger Bands® to gauge overall market trends and momentum.
A breakout aligned with favorable signals from other indicators strengthens the trade's potential and reduces the chance of a false breakout.
Additional Tips:
- Start Small: When starting with breakout trading, especially for beginners, consider taking smaller position sizes. This helps limit potential losses if you encounter a false breakout.
- Focus on High Probability Breakouts: Instead of chasing every breakout opportunity, prioritize well-defined support/resistance zones with a history of strong price reactions. This increases the likelihood of the breakout being genuine and reduces the risk of false signals.
- Always Practice Risk Management: Regardless of your entry strategy, always use proper risk management techniques. This includes setting appropriate stop-loss orders and managing position size effectively.
By understanding false breakouts and implementing these mitigation strategies, you can become a more disciplined breakout trader, reducing potential losses and increasing your chances of profiting from genuine breakout opportunities.
Trade Smarter!


