How to make a Trade Setup for Range-Bound Markets

Experienced traders generally divide the market into three categories: trending, consolidating, and range-bound. This classification helps them identify potential trading opportunities based on the price movement characteristics of each market type.
While trend trading and strategies like swing trading are among the most discussed high-impact trading setups, range-bound markets offer significant opportunities for traders with the right approach. However, specific information on trading range-bound markets can sometimes be less abundant.
This blog post dives into the world of range-bound markets. We'll explore how to identify them, develop effective trading strategies, and set yourself up for success in these sideways markets.
Let's get started!
What are range-bound markets?
A range-bound market is one where the price of an asset, like a stock or currency, fluctuates within a specific price zone for a prolonged period.
Instead of trending upwards or downwards, the price bounces back and forth between a well-defined high (resistance level) and a low (support level).
Range-bound markets show horizontal price movement. This means the price action is relatively flat, with highs and lows forming a horizontal channel.
With short-term price swings, the market can be volatile within the range, but the overall trend is sideways.
Trade Setups for range-bound markets
A trade setup refers to a set of conditions or technical indicators a trader uses to identify a trade's potential entry and exit points. In the case of range-bound markets, the trade setup involves placing the range, support, and Resistance levels and then planning entry near support for longs and Resistance for shorts.
How do range-bound markets offer trading opportunities?
Range-bound markets offer trading opportunities through a strategy called range trading. This strategy capitalizes on the predictable price movements within a defined range. Here's how it works:
Step1- Identify the Range:
Step2- Spot Support and Resistance:
Step3- Buy at Support, Sell at Resistance:
Step4- Use Technical Indicators to identify Entry and Exit Points (Optional)
Step5- Never leave Risk Management
Let's have a look at each step in detail;
Step1- Identify the Range:
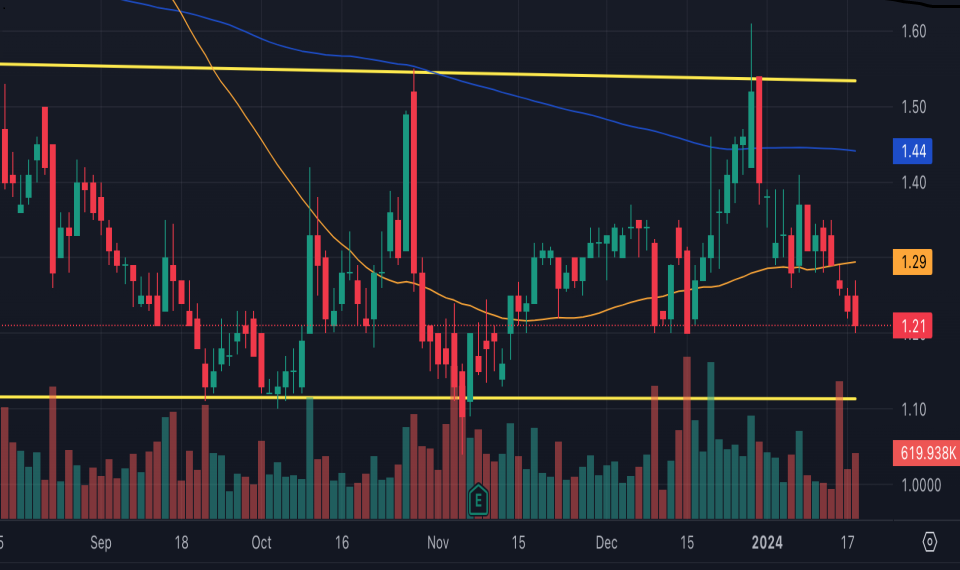
The first step is to confirm a range-bound market. This means the price should have established a clear channel with at least two similar highs and lows.
You can confirm a range by looking at the Price Action and Channels
For this, you can look for horizontal Price movement. Look for a chart where the price action is relatively flat, with highs and lows forming a horizontal channel. This signifies a need for a directional solid trend.
You can also observe if the price bounces off specific price points repeatedly. These become the support (buying zone) and resistance (selling zone) levels, indicating the range boundaries.
Technical Indicators can also be used to identify range-bound markets
A cluster of moving averages (like 50-day and 200-day) hovering close together can suggest a range-bound market, as they don't show a clear upward or downward slope.
You can pay attention to narrow bands. When the bands contract and stay close together, it can indicate a period of consolidation, potentially leading to a range.
A consistently low ATR (a volatility measure) over a period can also suggest a range-bound market, as price swings are limited.
Step2: Identifying Support and Resistance:
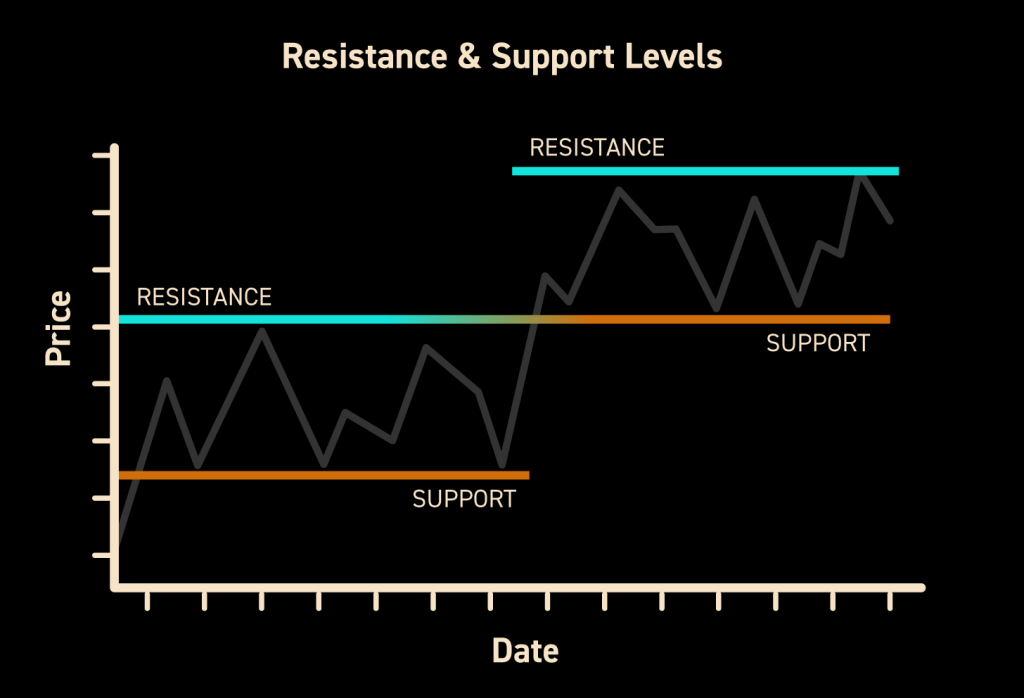
Once you've identified a potential range through horizontal price movement or a channel on the chart, it's crucial to pinpoint the support and resistance levels with more precision. These levels act as boundaries within which the price is expected to bounce back and forth.
For support, Look for the price zone where previous price declines have been halted or reversed. It represents an area of accumulated buying interest.
To identify support areas, you can look for places where the price has dipped but then encountered buying pressure, causing it to reverse and climb back up. These reversal points become potential support zones.
Draw horizontal lines across these areas where price reversals occurred. Multiple price touches on these lines strengthen the support level.
Higher trading volume on a price touch can indicate strong buying support at that level.
For Resistance, you can look for the price zone where previous price advances have been halted or reversed. It represents an area of selling pressure. Here's how to identify Resistance:
These Resistance areas can be identified by looking for areas where the price has attempted to move higher but faced selling pressure, causing it to fall back down. These reversal points become potential resistance zones.
Once identified, draw horizontal lines across these areas where price reversals occurred. Multiple price touches on these lines strengthen the resistance level.
Higher trading volume on a price touch can indicate intense selling pressure at that level.
Impact of timeframes on support and resistance levels;
Support and resistance levels can appear on all time frames. For instance, a price might find support at a specific level on the daily chart, but that level might not necessarily be a support zone on the weekly chart. The reason is that the significance of a price level can change depending on how far you zoom in or out on the price history.
The time frame you choose for your trading strategy will influence how you identify and utilize support and resistance levels. Here's why:
Day traders focusing on short-term price movements might prioritize support and resistance levels on lower time frames like the hourly chart.
On the other hand, traders with a longer-term perspective might focus on support and Resistance in higher time frames like the weekly or monthly chart. This can indicate more robust buying or selling zones with potentially higher impact on the price movement.
Step3- Buy at Support, Sell at Resistance:
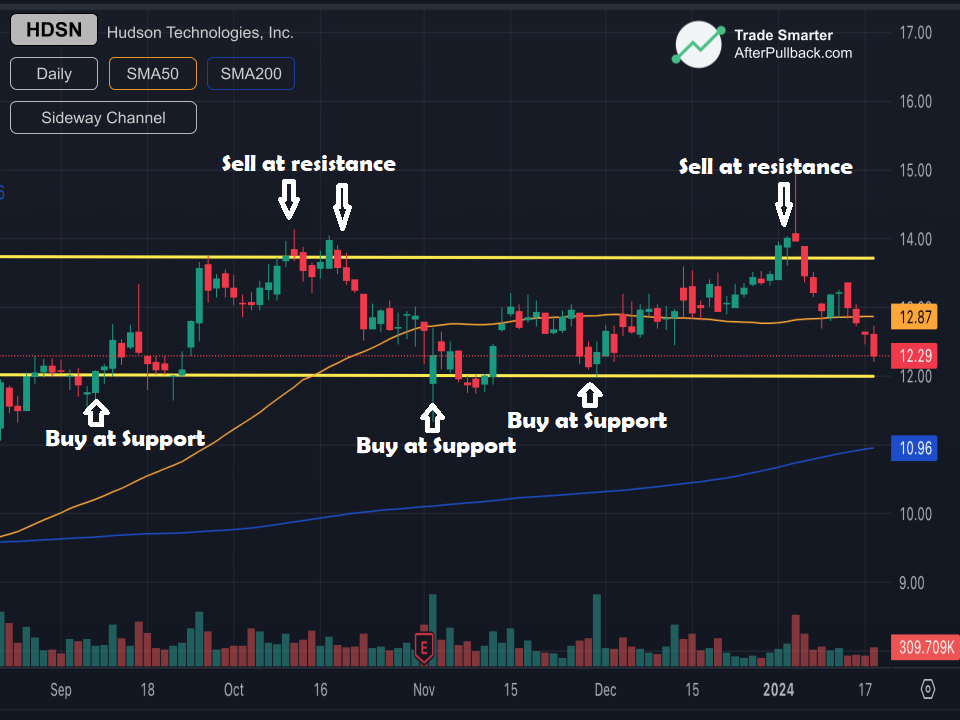
The core principle of range trading boils down to buying near support and selling near Resistance. This strategy assumes that the price will likely bounce off these levels and resume movement within the established range.
And how do we do it?
Let's have a look at some details.
When the price approaches the support level, it signifies a potential buying opportunity. The idea is to enter a long position (buying an asset), expecting the price to reverse course and trend higher towards Resistance.
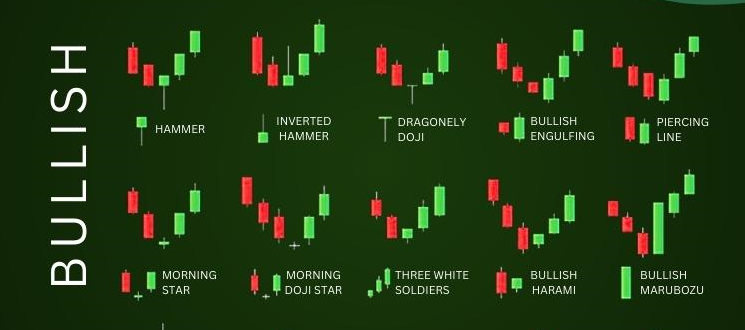
You can Look for bullish reversal signals around support zones, such as pin bars or bullish engulfing candlesticks, to increase confidence in your entry point.
Similarly,
As the price nears Resistance, it indicates a potential selling opportunity.
You would enter a short position (selling a borrowed asset), anticipating the price to reverse and fall back down toward support.
To Confirm this selling opportunity,
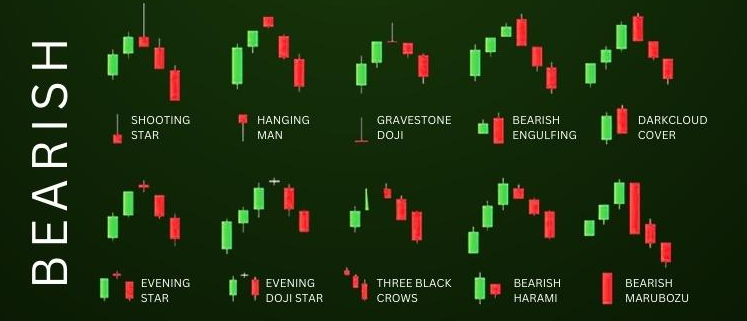
To strengthen your short trade entry, you can look for bearish reversal signals around resistance zones, such as shooting stars or bearish engulfing candlesticks.
Step4- Use Technical Indicators to identify Entry and Exit Points (Optional)
While support and resistance levels are the foundation of range trading, some traders incorporate technical indicators to fine-tune their entry and exit points within the range potentially. Combining the two can give the trade setup a higher chance of success. These indicators can provide insight into price momentum, potential reversals, and overbought/oversold conditions.
Here are some common Indicators for Range Trading:
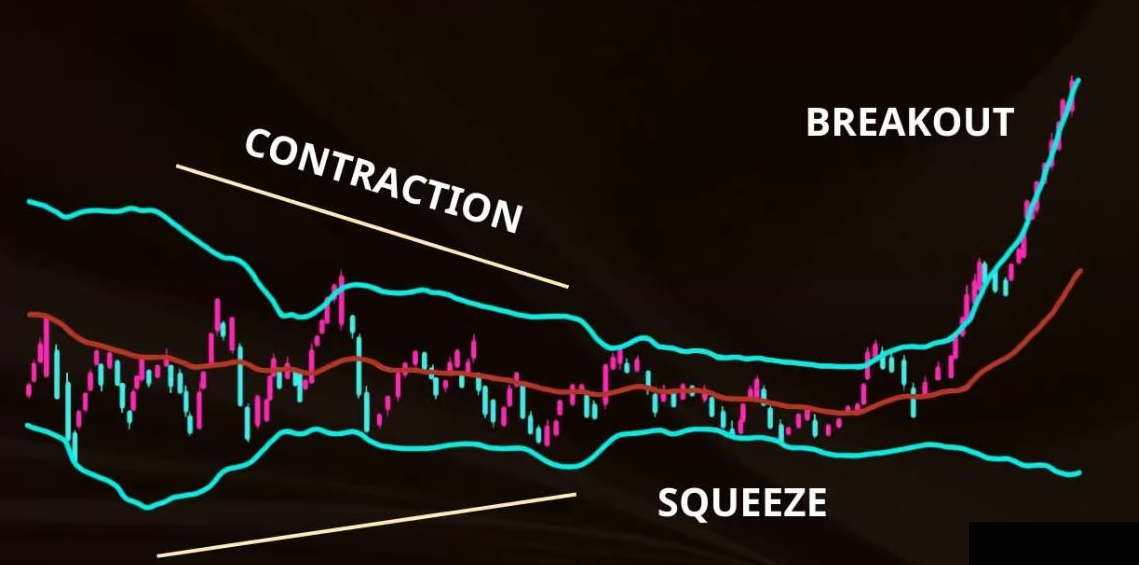
Bollinger Bands consist of a moving average (typically the 20-day) with two bands plotted above and below it. The bands expand and contract based on volatility. In a range-bound market, Bollinger Bands tend to contract and stay narrow.
A price squeeze towards the lower Bollinger Band could signal a potential buying opportunity near support, anticipating a bounce back up.
Conversely,
A price squeeze toward the upper Bollinger Band could indicate a selling opportunity near Resistance.
For Exit Entries, If the Bollinger Bands start to widen, it might suggest increasing volatility, potentially foreshadowing a breakout from the range. This could be a signal to exit your range trading positions.
Similarly to Bollinger Bands, the Relative Strength Index (RSI) indicates overbought or oversold conditions. The RSI will typically fluctuate between 30 and 70 in a range-bound market.
So,
For an Entry, An RSI value approaching 30 (oversold) near support could signal a potential buying opportunity. Conversely, an RSI value nearing 70 (overbought) near Resistance could indicate a selling opportunity.
Similarly,
For an Exit, A sharp rise in RSI above 70 or a plunge below 30 could suggest a potential breakout from the range, prompting you to re-evaluate your position.
You can also use the Average True Range (ATR). The ATR is a volatility indicator that measures the average range of true price movement over a chosen period. A consistently low ATR in a range-bound market suggests limited price swings.
So,
While ATR doesn't directly pinpoint entry points for an Entry, it can help assess the potential profit range within the established range. Lower ATR suggests smaller price swings so that traders might adjust their profit targets accordingly.
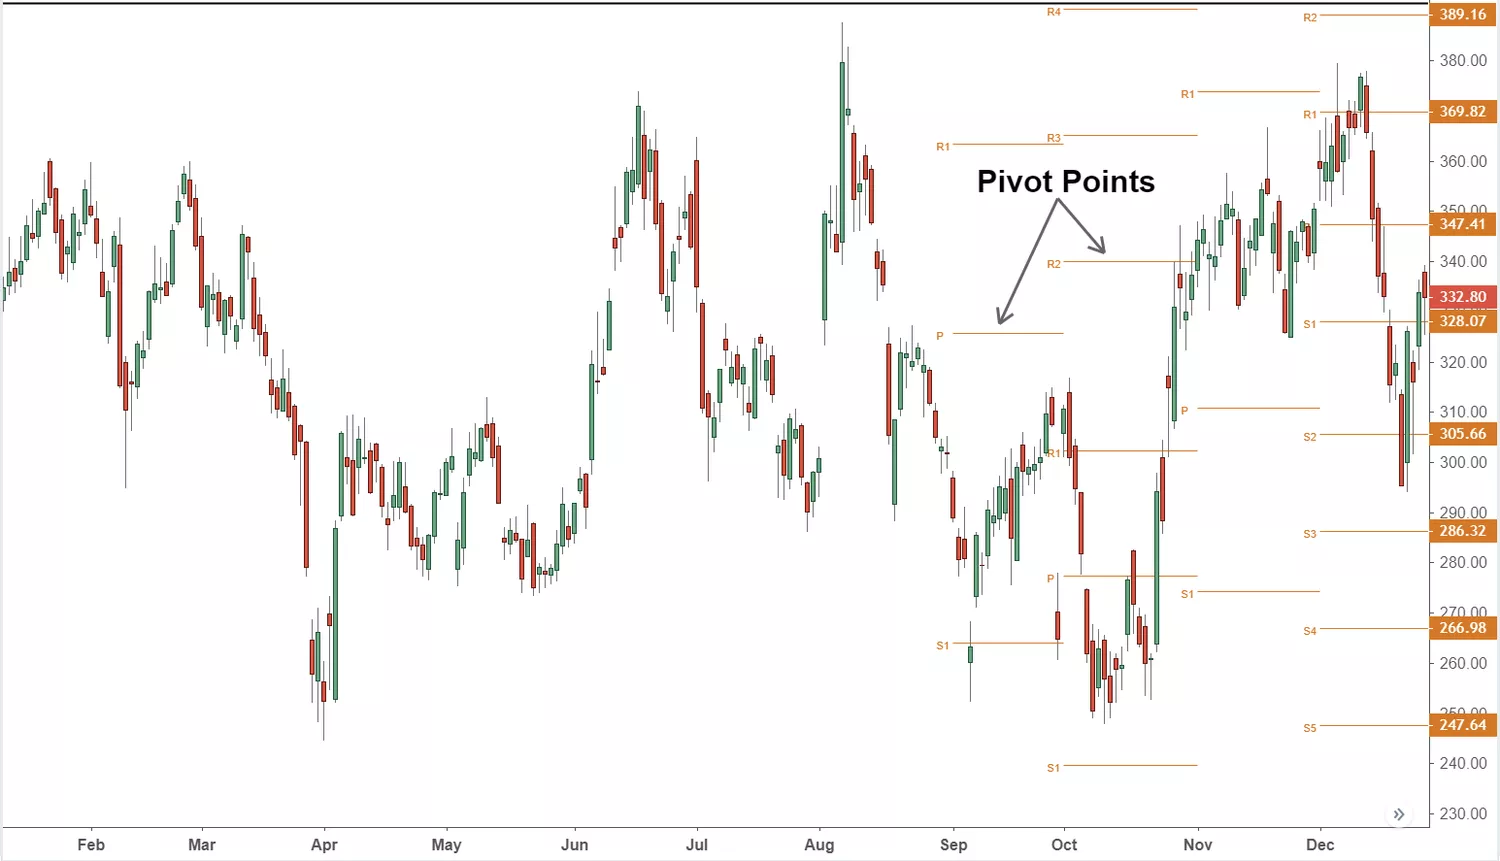
You Can also use Pivot Points to enter the trade. Pivot points are calculated based on the previous day's trading range (high, low, close) and can generate support and resistance levels.
These calculated support and resistance levels can act as additional confirmation points alongside your own identified support and Resistance for an entry.
Step5- Never leave Risk Management
While range trading offers opportunities to profit from repetitive price movements, it's not without risks. If you need to prepare, the price can always break out of the established range unexpectedly, leading to significant losses.
So, How do you tackle such situations?
Yes, by Limiting your Losses!
Experienced traders Limit their losses by setting up a Stop Loss order to automatically buy or sell a security once the price reaches a predetermined level. By placing a stop-loss order, you set a limit on how much you're willing to lose on a trade.
Now, Stop Losses can be set through various methods. Stop Loss Using ATR & setting stop loss using Moving Averages are some of the many methods of placing stop loss.
Stop-loss orders also help you stay disciplined and avoid the emotional temptation of holding onto a losing position, hoping the price will eventually reverse.
By automatically exiting a trade when the stop-loss level is triggered, you can preserve your capital and prevent further losses if the price moves against your trade.
And
How do you place Stop-Loss in Range Trading?
Below is one way to do it.
When entering a long position (buying) near support in a range-bound market, you should place a stop-loss order above the resistance level. This ensures that if the price unexpectedly breaks above the Resistance and the range breaks down, your long position will be automatically closed, limiting potential loss.
Conversely,
When entering a short position (selling) near Resistance, you should place a stop-loss order below the support level. This way, if the price breaks below support and the range breaks upwards, your short position will be automatically closed, minimizing loss.
Conclusion:
In conclusion, while often overlooked, range-bound markets offer significant trading opportunities through a strategy called range trading. By understanding how to identify these markets, pinpoint support and resistance levels, and potentially utilize technical indicators for entry and exit signals, you can capitalize on the repetitive price movements within the range. Remember, effective risk management with stop-loss orders is crucial to protect your capital and limit potential losses. With a well-defined trading plan and disciplined execution, you can navigate the sideways markets and position yourself for success in range-bound environments.


