How to Identify Entry Signals with Gap Ups and Gap Downs

Imagine a stock's price history visualized on a chart. Ideally, the price would appear as a continuous line, reflecting every single trade throughout the day. But sometimes, there are sudden jumps in price, leaving empty spaces behind. These empty spaces are called gaps, and they can be crucial indicators for Professional traders
Why Do Gaps Occur on Price Charts?
Gaps occur in price charts because there's a period where trading for a particular security wasn't happening, but the price itself changed significantly. This can happen for a few reasons:
- Market Closures: The most common reason for gaps is the market being closed. Imagine a stock closes at $100 on Friday evening. Over the weekend, a major positive announcement is made about the company. When the market opens on Monday, there might not be any trades at $100 or any price in between. Investors eager to buy after the news will push the price to jump significantly higher, say $110, leaving a gap between $100 and $110 on the chart.
- News Events: News events happening outside of regular trading hours can also trigger gaps. For example, a negative earnings report released after hours might cause a gap down (price sharply falls) when the market opens the next day.
- Liquidity: Gaps are more common in stocks with lower liquidity (fewer shares traded). This is because it can take fewer trades to push the price through support or resistance levels, creating a gap.
Now, that you know why gaps occur on price charts, It will be feasible to discuss
Type of Gaps on Price Charts
Broadly speaking, Gaps on price charts can be identified during trends. They can be categorized into three categories
1. Breakaway Gap:
Well, A breakaway gap appears when the price on the new trading day (opening price) is significantly higher (uptrend) or lower (downtrend) than the previous day's closing price.
Breakaway gaps are indicators for potential trend continuations. They suggest a strong surge in buying pressure (uptrend) or selling pressure (downtrend), indicating that the price has broken free from the previous trading range. This can be a sign of a new trend starting.
2. Exhaustion Gaps:
Exhaustion gaps occur towards the end of a strong uptrend or downtrend. The price seems to "jump" further in the direction of the existing trend, leaving a gap behind.
But,
Exhaustion gaps are a bit of a double-edged sword
Why?
Because,
On one hand, They can indicate continued strong momentum in the existing trend, suggesting the price isn't done moving yet.
On the other hand,
they can also be a sign of weakening trend strength. Be cautious with these gaps, as they require further confirmation before acting on them ( More on these Exhaustion Gap Downs below)
3. Common Gaps
These are the most frequent but least informative gaps. They are smaller jumps in price that don't necessarily signal a strong trend change or breakout.
Common gaps often occur due to random fluctuations in supply and demand or news events happening outside of regular trading hours. They don't provide a strong directional signal and shouldn't be relied on heavily for making trading decisions.
How to Differentiate these Price Gaps on charts?
You can differentiate between these gap types based on the location of these Gaps and their Size,
1. Breakaway Gaps:
Location: Look for breakaway gaps at the beginning of a potential trend change. In an uptrend, they'll appear after a period of consolidation near resistance. In a downtrend, they'll form after support has been broken.
Size: Breakaway gaps are typically larger than common gaps. The bigger the gap, the stronger the potential breakout signal, but also consider the average daily trading range for that specific asset.
2. Exhaustion Gaps:
Location: These appear towards the end of a strong trend, either up or down. The price makes a final surge in the direction of the trend before potentially reversing.
Size: Exhaustion gaps can be of varying sizes, but they're typically smaller than breakaway gaps..
3. Common Gaps:
Location: These can appear anywhere on the chart, with no clear relation to support or resistance levels.
Size: Common gaps are the smallest of the three types. They might just be a few ticks or points wide.
Summarizing all the above,
| Type of Gap | Appearance | Signal | Why Important | How to Differentiate on Charts |
| Breakaway Gap | - Price on new day significantly higher (uptrend) or lower (downtrend) than previous day's close. - Creates a clear jump on the chart. | Potential trend continuation | - Suggests strong buying/selling pressure, breaking free from previous range. - May signal a new trend starting. | - Look for them at the beginning of a potential trend change. - In uptrends, after consolidation near resistance. - In downtrends, after support is broken. - Typically larger than common gaps. |
| Exhaustion Gap | - Occurs towards the end of a strong trend (up or down). - Price jumps further in the direction of the trend, leaving a gap. | Double-edged sword | - Can indicate continued strong momentum. - May also signal weakening trend strength (last hurrah before reversal). - Caution is needed. | - Appear towards the end of an existing trend. - Can be of varying sizes, but usually smaller than breakaway gaps. |
| Common Gap | - Smaller jumps in price. - No clear relation to support or resistance. | Least informative | - May occur due to random fluctuations or news events outside trading hours. - Not a strong directional signal. | - Can appear anywhere on the chart. - Smallest of the three gap types (few ticks or points). |
Are there any tools to identify these gaps ?
While many charting tools allow you to see gaps visually, some offer specific features to highlight them more prominently:
Gap Lines: Many charting platforms allow you to add horizontal lines to your chart. You can use these to manually draw lines at the top and bottom of gaps, making them visually distinct.
Colored Gaps: Some charting software lets you customize the color of gaps to differentiate them from regular price bars. For example, you could color breakaway gaps green (potentially bullish) and exhaustion gaps red (potentially bearish).
Gap Detection Studies: A few advanced charting platforms offer technical indicators specifically designed to identify gaps. These studies can automatically highlight gaps on your chart and sometimes even categorize them based on size or location.
Ok, So Now you have a fair idea of the how these Signals Look like
So, We move to the Important Question of
How to Identify Entry Signals In Breakaway Gap Ups?
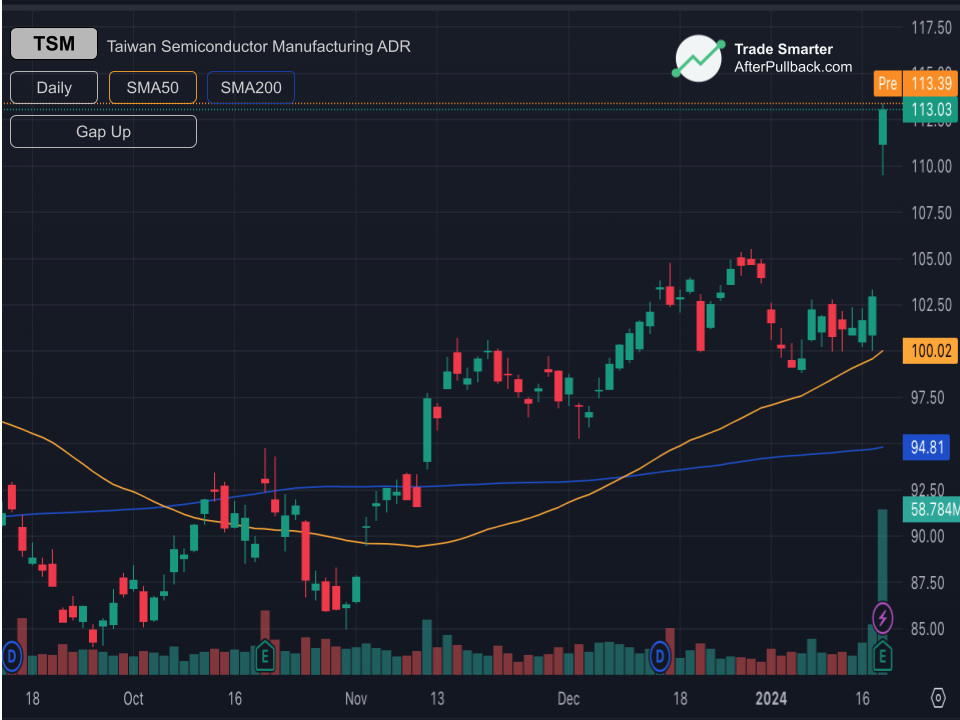
For this, Lets think of a stock that's been trading sideways for a while. The price keeps bouncing between a specific price range, establishing a well-defined resistance level at the top. This resistance level acts like a ceiling, preventing the price from breaking through consistently.
Suddenly, there's a surge in buying pressure. This could be due to positive news, strong earnings reports, or simply increased investor confidence.
The buying pressure overwhelms sellers, and the price gaps significantly above the previous resistance level. This gap signifies that trading activity skipped a range of prices entirely, highlighting the strength of the move.
SO, this will give us
The Entry Signal!
This breakaway gap up suggests a potential trend continuation and thus will allow us to make an entry.
The reason we believe it's an entry signal is because
The price has decisively broken through a key resistance level that was previously acting as a barrier. This signifies a shift in market sentiment and a potential power struggle won by the bulls (buyers).
And here is an interesting part
The Psychological Impact!
You see, The gap itself creates a psychological barrier for sellers. The empty space between the resistance level and the new opening price can act as a support zone, making sellers hesitant to short the stock at those levels.
 Imran Haider
How to Identify Entry Signals in Breakaway Gaps Down?
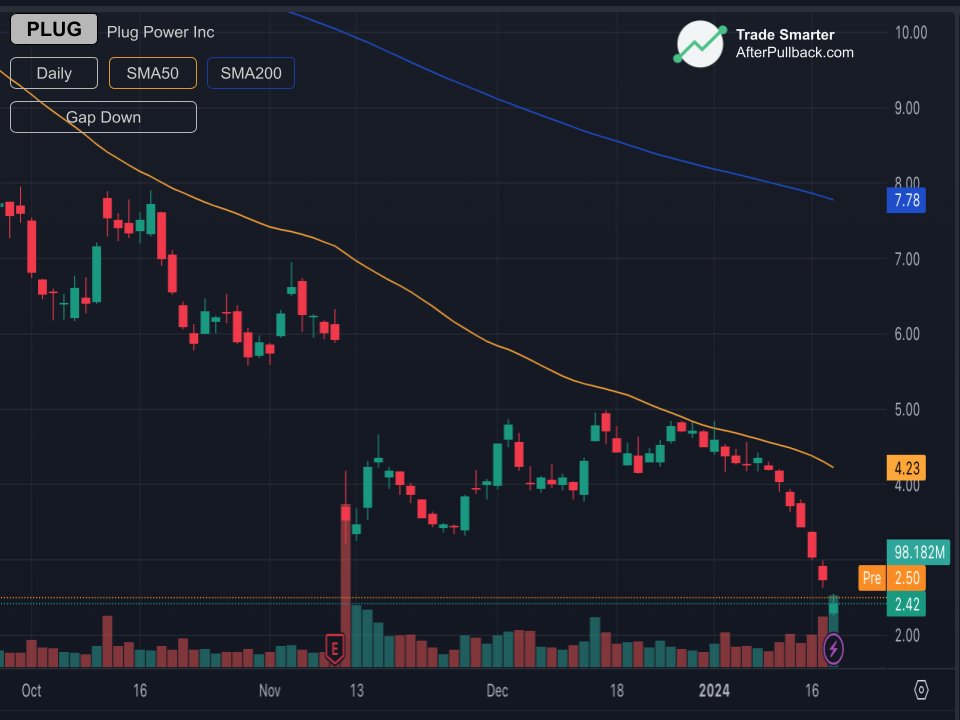
For Breakaway Gap Downs, Consider a stock that's been on a steady decline, creating a downtrend. The price keeps bouncing off a specific price range, establishing a well-defined support level at the bottom. This support level acts like a floor, preventing the price from falling much lower.
Suddenly, there's a surge in selling pressure. This could be due to negative news, disappointing earnings reports, or simply increased investor fear.
The selling pressure overwhelms buyers, and the price gaps significantly below the previous support level. This gap signifies that trading activity skipped a range of prices entirely, highlighting the strength of the move down.
And this Gap Down creates
The Entry Signal
Why?
Because This breakaway gap down suggests a potential downtrend continuation and thus creates an opportunity for an entry
And as for the Gap Up above, this GapDown also has reasons to suggest an entry.
The very first reason being that, It has
Broken Support!
The price has decisively broken through a key support level that was previously acting as a floor. This signifies a shift in market sentiment and a potential power struggle won by the bears (sellers).
As with Gap Ups , It also creates a
Psychological Impact!
The gap itself creates a psychological barrier for buyers. The empty space between the support level and the new opening price can act as a resistance zone, making buyers hesitant to buy the stock at those levels.
You see,
Breakaway gaps down might seem like slam dunks for short sellers (those betting the price will go lower) in a downtrend. But sometimes, things aren't as clear-cut.
Why?
Because of
Exhaustion gaps down
To understand Exhaustion Gap Downs, consider a Scenario;
Imagine a stock that's been in a relentless downtrend for a while. The price keeps making lower lows, and sellers seem to be in control.
Suddenly, there's a massive surge in selling pressure. This could be due to extremely negative news or panic selling at the end of a long downtrend.
The selling pressure is so strong that the price gaps significantly below the previous day's close. This seems like a classic breakaway gap down, confirming the downtrend.
However,
this might be an exhaustion gap down in disguise.
Exhaustion gaps down appear towards the end of a downtrend, not the beginning. Here's why they require caution because of:
Seller Exhaustion!
The massive price drop might signal that sellers are finally running out of steam. They might have already sold most of their holdings, and there could be fewer sellers left to continue pushing the price down.
and,
Potential Trend Reversal!
This exhaustion of sellers could be a turning point. With fewer sellers and potentially some bargain hunters emerging, the price might be ready to reverse course and start an uptrend.
Why caution is needed?
Because,
It can be a
False Downtrend Confirmation
If you mistake an exhaustion gap for a regular breakaway gap, you might enter a short position expecting the downtrend to continue. However, if the price starts reversing, you could face significant losses ( Here is what to do deal with trading losses)
How to Trade with Exhaustion Gaps Down?
With Exhaustion Gap Downs,
Confirmation is Crucial!
Don't blindly short just because of an exhaustion gap down. Look for additional signs of weakness, like failing follow-through after the gap (price not continuing to fall) or decreasing volume.
You Should also
Consider Other Indicators!
Combine the gap with technical indicators like moving averages or RSI. If these indicators show signs of a potential reversal (like a reversal pattern or RSI nearing oversold territory), be extra cautious.
Beyond the Initial Jump- How to Refine your Entry Signals
Ok,
Now this is also a very important aspect to consider.
You see,
Gaps can be like flashing lights on a stock chart, grabbing your attention and hinting at potential breakouts. But to truly capitalize on these signals, you need to look beyond the initial jump and use additional tools to refine your entry timing.
Here's how technical indicators like RSI, Moving Averages, and price action confirmation can help you do just that:
1. The RSI (Relative Strength Index):
The RSI is a momentum oscillator that helps identify overbought (potentially ready to fall) and oversold (potentially ready to rise) conditions. Here's how it can be used with gaps:
In Breakaway Gaps Up, If a breakaway gap up occurs, and the RSI is not yet overbought (below 70), it suggests there might be more room for the price to rise before a potential correction. This can help you time your entry after the gap, aiming for a pullback before the next leg up.
On the other hand,
In Exhaustion Gaps Down, If you see an exhaustion gap down, and the RSI is already oversold (above 70), it might indicate the selling pressure is exhausted, and a reversal could be imminent. This can help you avoid shorting (betting the price will go down) right after the gap and potentially wait for a confirmation of a downtrend reversal before entering.
2. Moving Averages: Identifying Trends and Support/Resistance
Moving averages smooth out price fluctuations and help identify trends. Here's how they can be used with gaps:
If a breakaway gap up occurs, and the price subsequently moves above a key moving average (like the 50-day or 200-day moving average), it strengthens the uptrend signal. This can give you more confidence entering a long position (buying) after the gap.
Similarly,
If a breakaway gap down occurs, and the price falls below a key moving average, it strengthens the downtrend signal. However, be cautious with exhaustion gaps down. Look for the price to stay below the moving average for confirmation before entering a short position.
3. Price Action Confirmation
Price action analysis focuses on how the price itself behaves after the gap. Here's how price action can be used for better entry timing:
In Breakaway Gaps Up, Look for the price to hold above the gap after the initial breakout. If the price immediately falls back and fills the gap, it might be a weak breakout. Wait for a sustained move above the gap area before entering a long position.
In Exhaustion Gaps Down, Look for the price to struggle to continue falling after the exhaustion gap down. If the price starts to reverse and climb back above the gap area, it might signal a potential trend reversal. Avoid shorting right after the gap and wait for confirmation of a downtrend before entering.
Imran Haider
4. Volume is King
Whether you are entering or exiting a trad, Always factor in volume alongside other indicators. High volume on the day of the gap and after the gap strengthens the breakout signal.
Why?
Because,
Higher Volume = More Conviction
A large jump in volume on the day of the gap up signifies that many investors are interested in buying the stock at the higher price. This increased participation suggests stronger conviction behind the move, making it more likely to be a sustainable breakout and not just a fleeting price spike.
It also
Separating Signal from Noise
Volume helps differentiate between genuine breakouts and random fluctuations. A gap up with low volume might just be a temporary blip, but a gap up with high volume suggests a more significant shift in market sentiment, favoring the bulls (buyers).
How Much Volume is Enough?
There's no magic number for "enough" volume. Here are some things to consider:
Average Daily Volume (ADV): Compare the volume on the day of the gap up to the stock's Average Daily Volume (ADV). A significant increase above the ADV suggests a noteworthy buying surge.
Relative Volume: Look for the volume on the gap up day relative to the recent trading history. If it's one of the highest volume days in recent weeks, it adds weight to the breakout signal.
Remember
Gaps in crypto charts can be signals for potential breakouts or trend continuations, but they shouldn't be interpreted in isolation. Use them alongside other technical indicators and consider wider market factors to make informed trading decisions. Keeping this in mind will help you to
Trade Smarter!


