How to enter a trade using pivot points in trending markets

As a trader, sometimes you must have felt frustrated watching a strong uptrend unfold, only to miss the entry point?
The situations, where you can identify the overall bullish momentum by seeing the overall chart, but pinpointing the exact moment to jump becoming tricky for you?
It Happens!
The Fear of entering too early and missing out, or too late and chasing a runaway market, can lead to analysis paralysis and missed opportunities.
So, in the blog post below we will try to solve that dilemma. We'll introduce a powerful strategy that leverages pivot points to identify high-probability entry points during uptrends. By combining pivot points with key technical analysis principles, you'll learn to:
- Confidently identify healthy pullbacks within a strong uptrend.
- Utilize pivot points as potential support zones for strategic entry.
- Confirm entry signals with reliable price action patterns and volume analysis.
This approach equips you with a data-driven framework for entering uptrends with precision, allowing you to capitalize on the full potential of these powerful market movements. So, ditch the entry anxiety and get ready to conquer uptrends with the power of pivot points!
Strategy to identify entry points using Pivot Points in Pullbacks;
Identifying these entry points is a step by approach using pivot points and Pullbacks in trending markets; It can be completed in following steps
1. Step 1: Identifying Uptrends – The Foundation
2. Step 2: Setting the Stage for Entries with Pivot Points
3. Step 3: Recognizing Pullbacks and Refining Entry with Confirmation
4. Step 4: Putting It All Together – Entry and Stop-Loss Placement
But,
Not So fast!
The thing is, that the key to this strategy lies in understanding three fundamental concepts first; trends, pivot points, and pullbacks.
Trends:
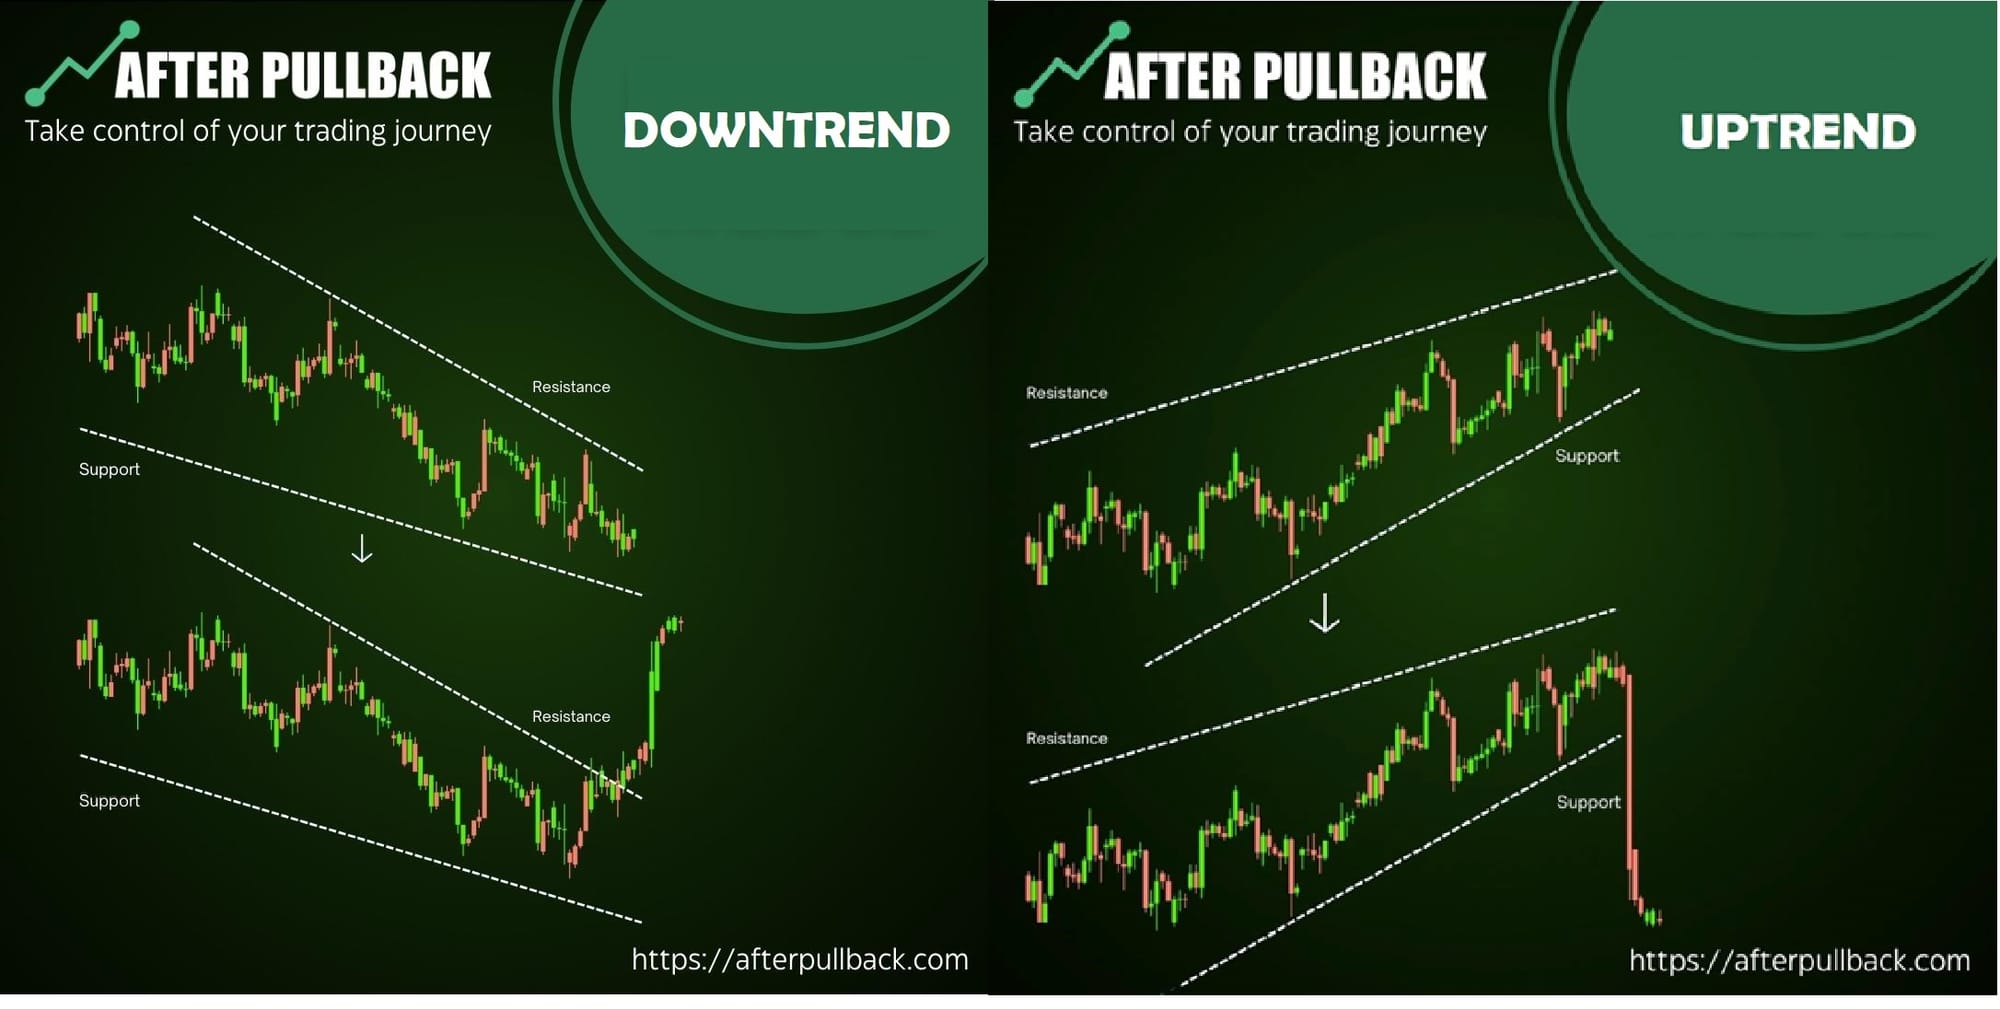
A trend simply refers to the overall direction of a market's price movement, either upwards (uptrend) or downwards (downtrend). Identifying these trends can be a powerful tool for Boosting you performance.
By understanding the trend, you can make informed decisions about buying or selling. During an uptrend, you'd typically look for opportunities to buy low and sell high as the price keeps climbing. Conversely, in a downtrend, you might look to short sell (borrow and sell an asset hoping to buy it back later at a lower price) or wait for dips to buy assets at a discount.
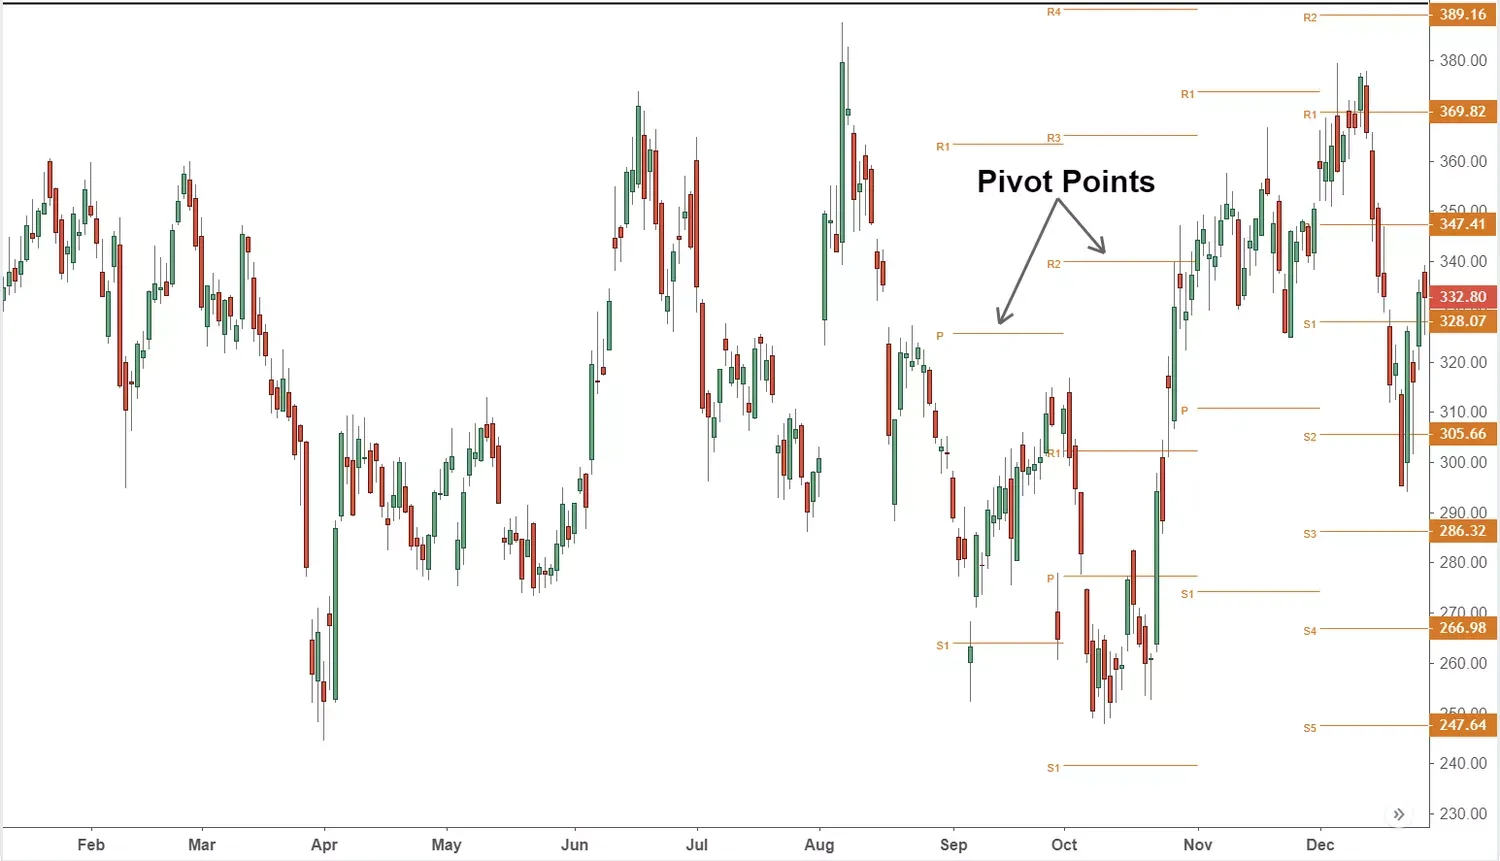
Pivot Points:
Pivot points are calculated values based on the prior day's high, low, and closing price. They help identify potential support and resistance zones within the market. They can guide you toward areas where the price trend might encounter potential turning points.
Due to this nature of Pivot Points can also be used to identify areas of stop loss placement.
Pullbacks:
Every uptrend experiences occasional setbacks. These are called pullbacks, where the price retraces some of its recent gains. While they might seem like a reversal, healthy pullbacks within an uptrend are often temporary and present valuable entry opportunities. The goal is to identify these pullbacks when they reach potential support zones (like pivot points) and use them as springboards to join the continuing uptrend.
Ok,
So, by understanding these core concepts, we've laid the groundwork for the next step:
The Entry Strategy: A Step-by-Step Approach
Now that we've established the building blocks – trends, pivot points, and pullbacks – let's explore how to leverage them to make strategic entries during uptrends.
Step 1: Identifying trends
Before zooming in on entry points, it's crucial to identify the overall trend direction in the market you're interested in.
Here's how most traders identify both uptrends and downtrends
Confirmation through Price Action
Observe the price movement on your chosen chart timeframe. An uptrend exhibits a series of higher highs and higher lows. Each price peak (high) should be consistently higher than the previous high, and each price trough (low) should be consistently higher than the previous low. This sequential pattern signifies a gradual increase in buying pressure, pushing the price upwards. Conversely, a downtrend exhibits a series of lower lows and lower highs. Each price trough (low) should be consistently lower than the previous low, and each price peak (high) should be consistently lower than the previous high. This sequential pattern signifies a gradual increase in selling pressure, pushing the price downwards.
Re-Confirmation with Moving Averages:
You see, while price action is essential, consider incorporating a technical indicator like a moving average to strengthen your trend identification. Moving averages smooth out price fluctuations and help visualize the overall trend direction. In a confirmed uptrend, the price should consistently trade above a chosen moving average (e.g., 50-period SMA or EMA). Ideally, the moving average itself should also be sloping upwards, confirming the rising trend. Conversely, in a confirmed downtrend, the price should consistently trade below the moving average, with the moving average itself ideally sloping downwards, confirming the falling trend.
Next Steps: With a confirmed trend in place (either up or down), we can set the stage for potential entry points during retracements (pullbacks in uptrends and rallies in downtrends). In Step 2, we'll explore how pivot points come into play as we identify these opportunities within the identified trend.
Step 2: Setting the Stage for Entries with Pivot Points
Having identified a confirmed trend (either uptrend or downtrend) using price action and potentially confirmed with a moving average, we can leverage pivot points to set the stage for potential entry opportunities during retracements.
Understanding Pivot Point Mechanics:
Before diving in, let's revisit pivot points. These are calculated values based on the previous day's high, low, and closing price, providing a framework for understanding potential support and resistance zones within the market. Many trading platforms offer built-in pivot point calculations, or you can find pivot point calculators online.
In Uptrends, the focus lies on support zones. Specifically, pivot point levels denoted as S1, S2, and S3 (calculated based on the formulas and typically presented in descending order of support strength) can act as potential buying areas during pullbacks within the uptrend.
Conversely,
In downtrends, the focus shifts to resistance zones. Pivot point levels denoted as R1, R2, and R3 (calculated formulas and typically presented in ascending order of resistance strength) can act as potential selling areas during rallies within the downtrend.
Why These Levels Matter:
The underlying logic is that if the price retraces within a trend, these pivot point zones (support in uptrends, resistance in downtrends) might entice traders to step in. This activity can then create a temporary pause in the opposing direction or even a reversal, leading the price back in line with the overall trend. These can also become ares for Stop Loss Placements
Step 3: Recognizing Pullbacks and Refining Entry with Confirmation
With a confirmed trend in place (either uptrend or downtrend) and an understanding of how pivot points act as potential support/resistance zones, we can now focus on identifying healthy retracements within the trend and refining our entry strategy using confirmation techniques.
But, what is retracement?
You see, all trends, up or down, experience temporary price movements against the trend direction, known as retracements. These are normal and expected occurrences within a trending market. The key lies in recognizing healthy retracements that present potential entry opportunities. Here's how to identify them:
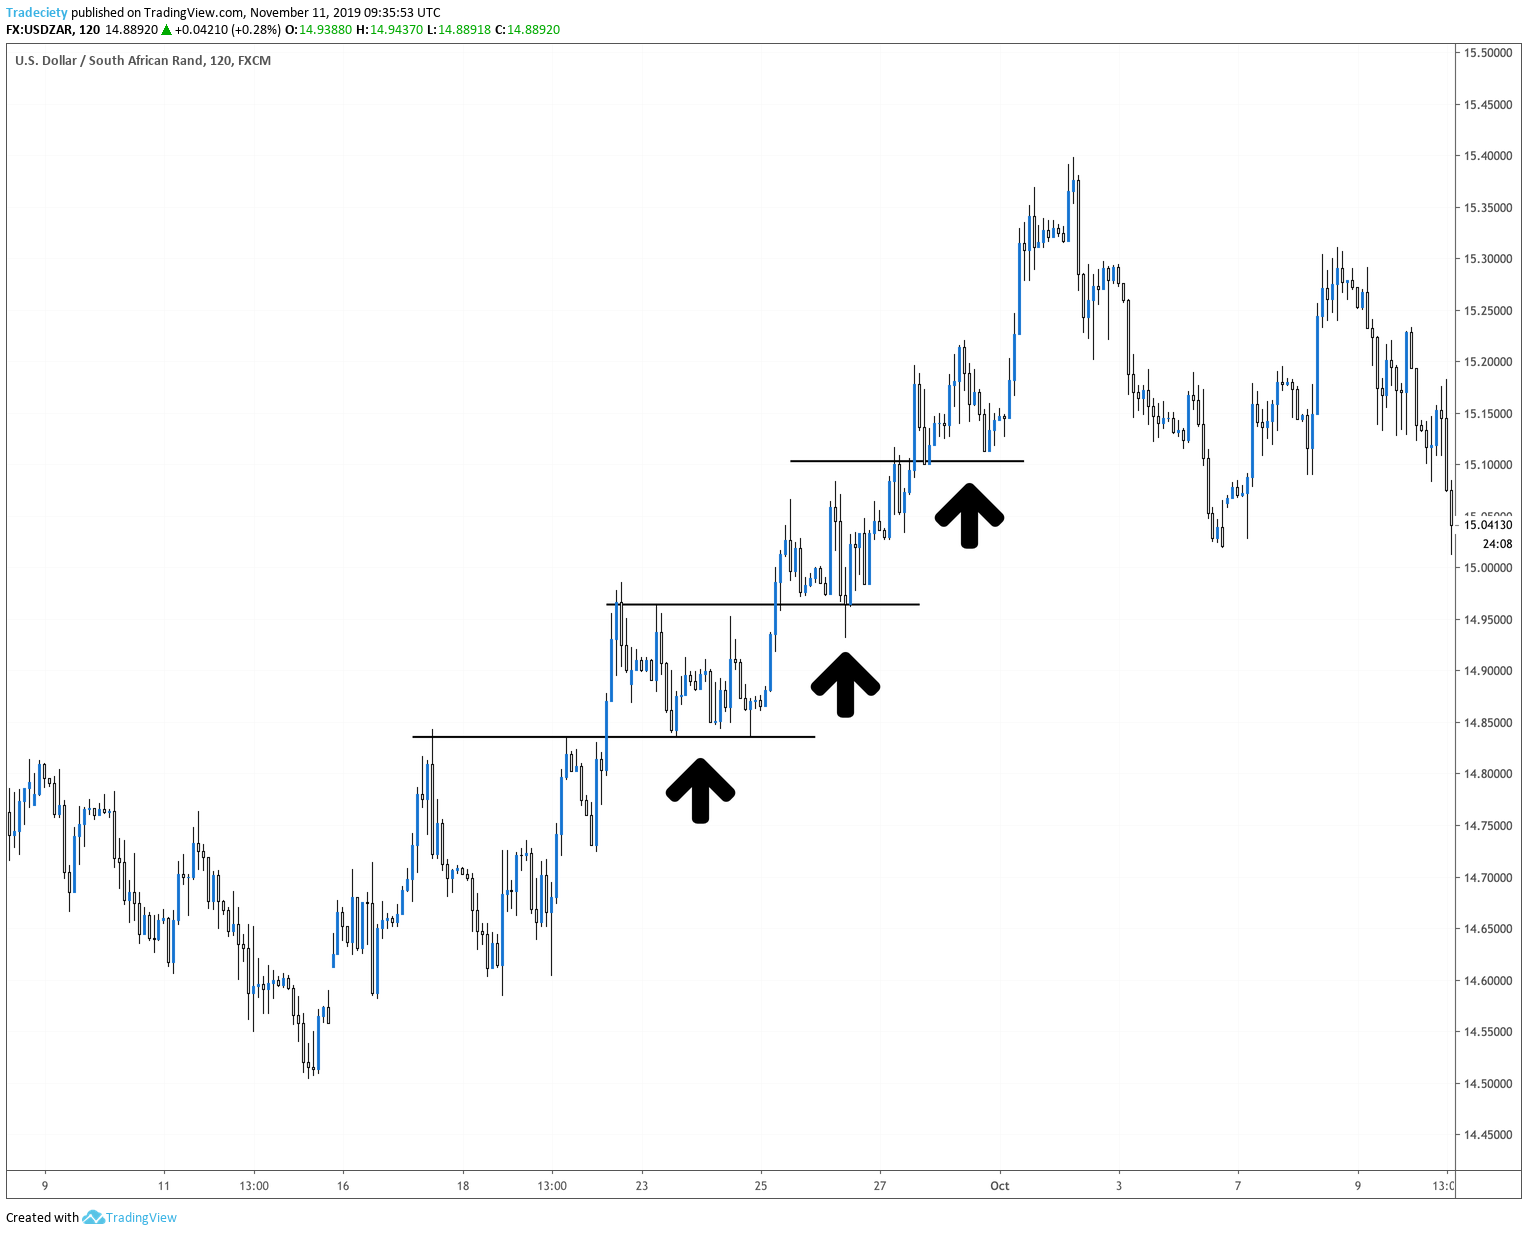
Opposing Price Movement: Observe the price action on your chart. In an uptrend, look for the price to deviate from its upward trajectory and start moving downwards. This indicates a temporary loss of buying momentum, leading to a pullback. Conversely, in a downtrend, look for the price to deviate from its downward trajectory and start moving upwards. This indicates a temporary loss of selling momentum, leading to a rally.
Depth of the Retracement: Not all retracements are created equal. Healthy retracements are typically shallow. They retrace a portion of the recent move against the trend but don't erase the entire trend itself. Ideally, they reach a support/resistance zone (depending on the trend) without completely negating the trend's momentum.
How the Pullbacks and Pivots interact together?
This is where the things get interesting.
The interaction of Pullbacks and the Pivot Points!
In this step, we will leverage the knowledge from Step 2. During a retracement, we will look for the price to find temporary support/resistance at one of the Pivot Points
In uptrends, focus on support zones (S1, S2, S3). If the price finds support around these levels during a pullback, it suggests potential buying interest emerging at these predetermined support zones.
In downtrends, we can focus on resistance zones (R1, R2, R3). If the price finds resistance around these levels during a rally, it suggests potential selling pressure emerging at these predetermined resistance zones.
Some other things may also be considered which can provide us some additional confirmation.
Recall those swing highs/lows identified earlier within the trend? These can sometimes act as support/resistance zones again during subsequent retracements.
Similarly, The moving average used for trend confirmation can also offer dynamic support/resistance, especially during shallower retracements.
Same way, Increased volume on reversal candlesticks adds credence to the reversal signal. Higher volume suggests more trading activity aligned with the potential trend direction, potentially pushing the price back in line with the overall trend.
Step 4: Putting It All Together – Entry and Stop-Loss Placement
At last,
We've arrived at a crucial stage – pinpointing the exact moment to enter a trade within a confirmed trend.
By understanding retracements, support/resistance zones, and confirmation techniques, we've built a strong foundation for identifying high-probability entry points. However, a complete entry strategy requires two additional considerations: entry placement and stop-loss placement.
Refining Entry Timing with Price Action:
Reaching a support/resistance zone with confirmation is a good starting point. Ideally, you can refine your entry timing even further using reliable price action patterns:
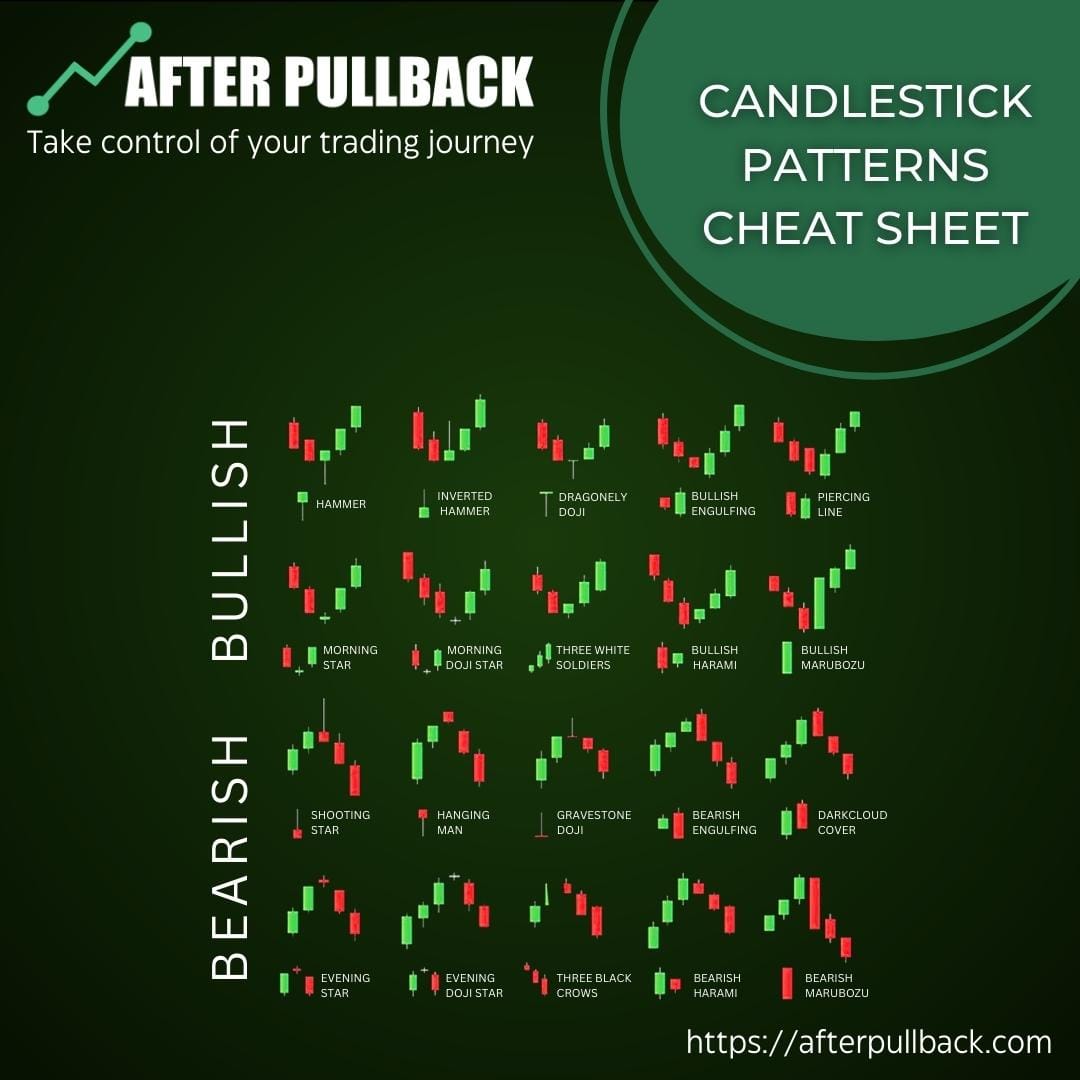
Uptrends: Look for bullish reversal patterns at the low of the pullback. These patterns signal a potential reversal of the downtrend and a possible resumption of the uptrend. (Examples: Hammer, Engulfing Bar, Bullish Pin Bar)
Downtrends: Conversely, look for bearish reversal patterns at the high of the rally. These patterns signal a potential reversal of the uptrend and a possible resumption of the downtrend. (Examples: Shooting Star, Bearish Engulfing Bar, Bearish Pin Bar)
Breakout: A confirmed breakout above the high of the pullback in an uptrend or below the low of the rally in a downtrend can be a strong entry signal. This suggests a shift in momentum and potential continuation of the overall trend.
Volume Confirmation:
Remember, increased volume on reversal candlesticks adds credence to the signal. Look for a surge in volume on the candlestick with the relevant price action pattern at the extreme of the retracement (low for uptrends, high for downtrends). This signifies strong buying or selling activity aligned with the potential trend direction.
Bottom Line!
Don't rely on any single confirmation factor in isolation. Look for a confluence of these elements – a retracement reaching a support/resistance zone, a reversal price action pattern at the extreme of the retracement, and ideally, increased volume on the reversal candlestick.
Stop-Loss Placement for Risk Management:
We will discuss the complete mechanism of Stop Loss placement in next blog, However, For A quick Look ,Here's how to place your stop-loss in this strategy:
A common approach is to place your stop-loss order just below the support zone you identified (pivot point level, previous low, or moving average). This minimizes potential losses if the price breaks below the support and the pullback continues further.
Conversely, in downtrends, place your stop-loss order just above the resistance zone you identified.
In Conclusion
By following these four steps – identifying uptrends, utilizing pivot points, recognizing pullbacks with confirmation signals, and strategically placing entry and stop-loss orders – you can equip yourself with a solid approach to capitalizing on potential trend continuations. Remember, practice and adapting this strategy to your specific risk tolerance and trading style are key to maximizing its effectiveness.
Trade Smarter


