How to do Swing Trading using Trend Trading Strategy

Swing trading is a strategy that aims to capture profits from these "swings" in price movements. Swing traders typically hold positions for days, weeks, or even a few months, aiming to profit from short- to medium-term trends. They rely heavily on technical analysis, using tools like charts and indicators to identify potential price swings and entry/exit points.
Trend traders, on the other hand, focus on identifying strong price movements in a specific direction, either up (uptrend) or down (downtrend). Their goal is to capitalize on these trends by holding positions for longer periods, potentially months or even years. They also utilize technical analysis, but may also consider broader economic factors that might influence trends.
Swing Trading within a Trend Following Approach
While trend trading focuses on the bigger picture, swing trading can be a great tool within this approach.
Think of it like this:
The trend is the main current, and swing trading allows you to capture smaller movements within that current. Swing traders can leverage technical analysis to identify opportunities to enter and exit positions along the trendline, aiming to ride the wave of the overall market direction.
The Strategy Involves the following steps
Step 1: Identifying the Trend
Step 2: Identify the Entry Points
Step 3: Identify Exit Points
Step 4: Never Forget Risk Management
Below, we will discuss these steps in detail;
Step 1: Identifying the Trend:
The foundation of any trend trading strategy is understanding the direction of the market.
& to identify the trend, we have certain tools in hand;
1) Trend Identification using Technical Indicators:
Moving Averages (MAs) are popular trend-following indicators that smooth out price fluctuations and reveal the underlying trend. Common examples include the 50-day and 200-day MAs.
An uptrend is generally signaled by the price consistently trading above a rising MA (e.g., 50-day MA above the 200-day MA).
Conversely, a downtrend is suggested by the price consistently trading below a falling MA (e.g., 50-day MA below the 200-day MA).
There are some other trend following indicators as well specifically designed to identify trends. Some examples include:
Average Directional Index (ADX): Measures the strength of the trend, with higher ADX values indicating a stronger trend.
Parabolic SAR (Stop and Reversal): Plots dots above or below the price, with a trend change potentially signaled when the dots shift positions relative to the price.
2) Trend Identification through Price Action:
Beyond relying solely on indicators, experienced traders can often identify trends through simple price movements on the charts:
How?
Lets see,
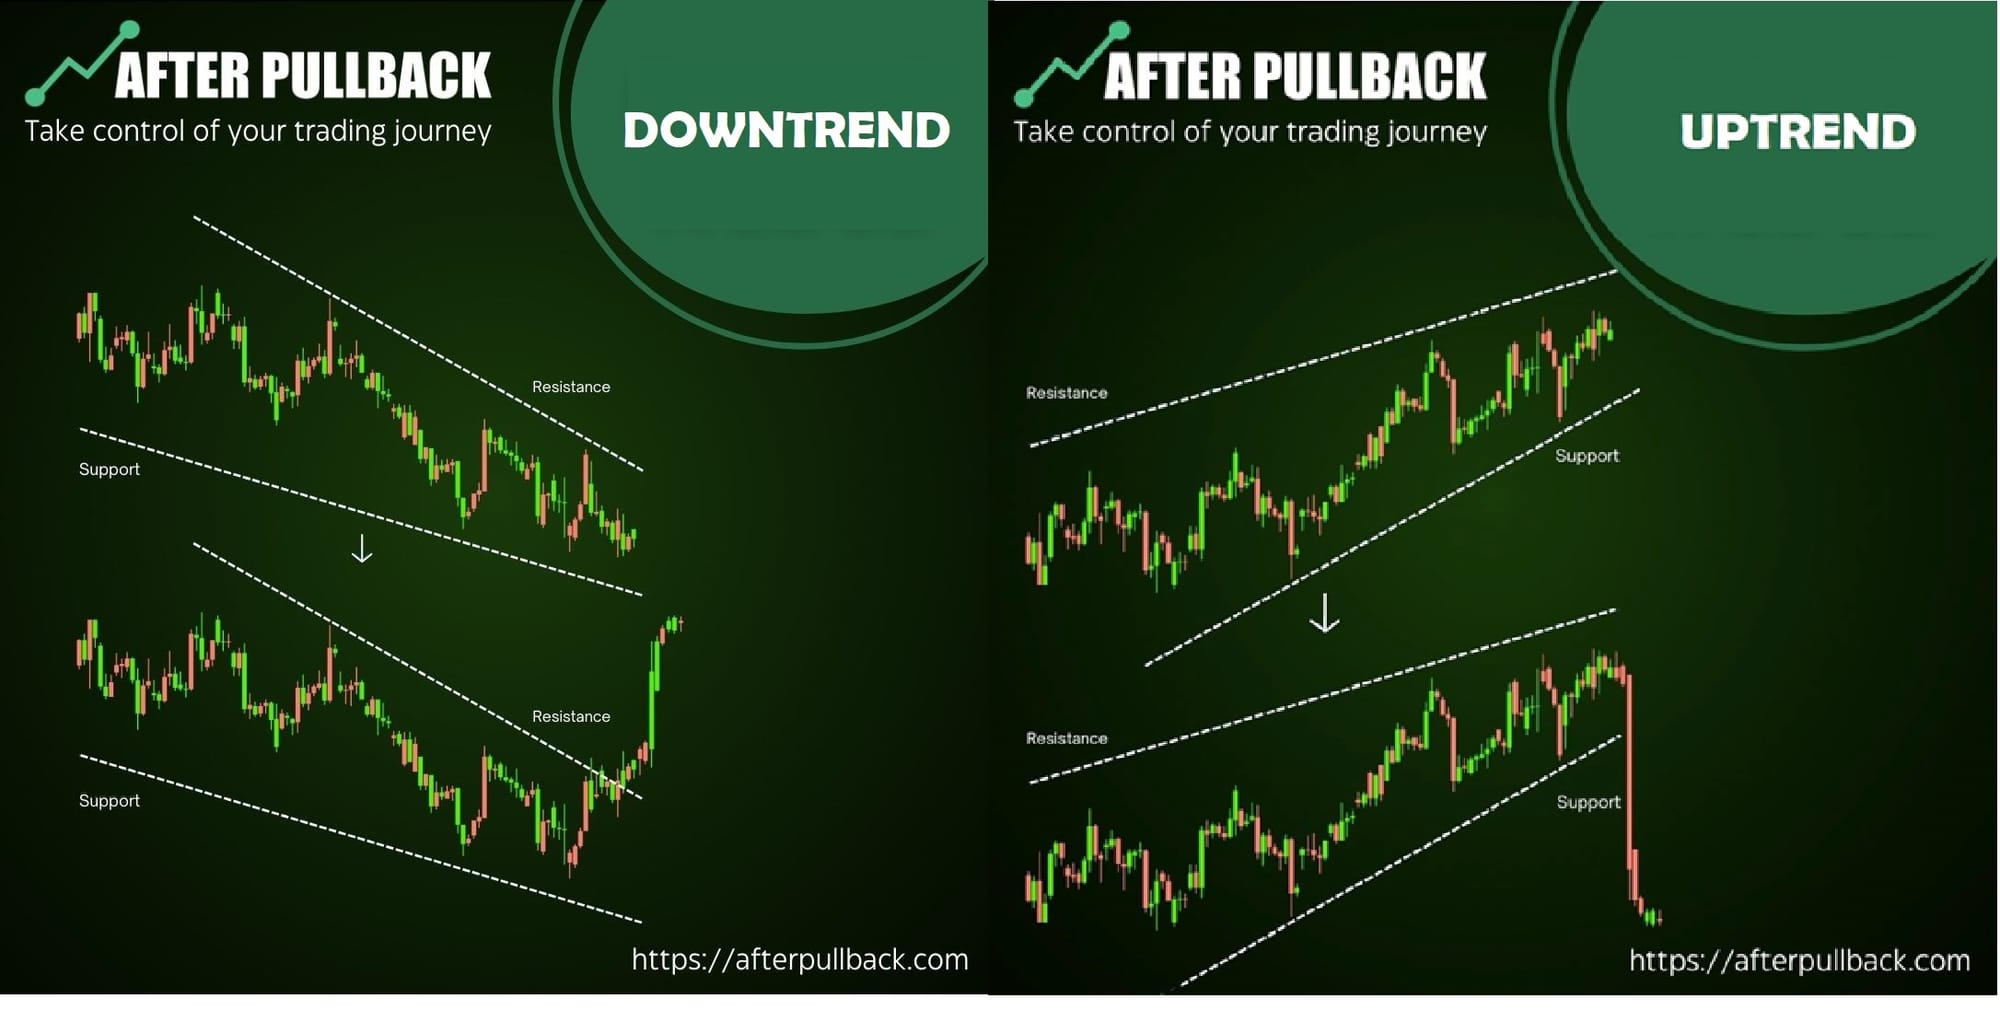
A series of higher highs (peaks) and higher lows (valleys) on the price chart suggests an uptrend. Each subsequent peak and valley is higher than the previous one, indicating the overall upward direction.
Conversely,
a series of lower highs and lower lows suggests a downtrend. Each peak and valley is lower than the previous one, indicating the overall downward direction.
3) Combining Indicators and Price Action:
Technical indicators are mathematical tools based on historical price data. They can provide valuable insights, but they have limitations.
You see,
Sometimes the Market Sentiment can shift unexpectedly due to some unexpected news events, economic data releases, or changes in investor sentiment. This can cause price movements that defy indicator signals.
Therefore, what most experienced traders do is to keep Price Action as a Leading Indicator. This approach offer clues about potential trend shifts before they are reflected in technical indicators.
For example, a series of weak rebounds at a resistance level might suggest a weakening uptrend, even before a moving average crossover signals a potential downtrend.
Moreover,
A rising price consistently trading above a rising moving average strengthens the uptrend confirmation. This confluence of signals suggests a trend with more momentum and potentially less risk of a false breakout.
But you have to remain vigilant!
Sometimes, price action and technical indicators might diverge. For instance, the price might continue to rise while a momentum indicator starts to decline. This divergence could be a signal of a weakening trend and a potential trend reversal
Step 2: Identify the Entry Points
Alright,
Up till now, we have identified that technical analysis identifies price zones where the price has historically bounced off, acting as support (for uptrends) or resistance (for downtrends).
Now,
These levels can also act as entry points in the direction of the trend.
For instance, in an uptrend, a swing trader might enter a long position (buying) near a support level, anticipating the price to rise again after a pullback.
Provided there is
Confirmation Signals from Indicators. Popular options include:
Using the Relative Strength Index (RSI), entering a long position near oversold levels (below 30) in an uptrend suggests the potential for a price rebound.
Or by using Moving Average Convergence Divergence (MACD). When the MACD line (difference between two moving averages) crosses above its signal line, it can indicate a potential upswing, while a downward crossover might signal a downtrend.
There can be some other entry Points as well
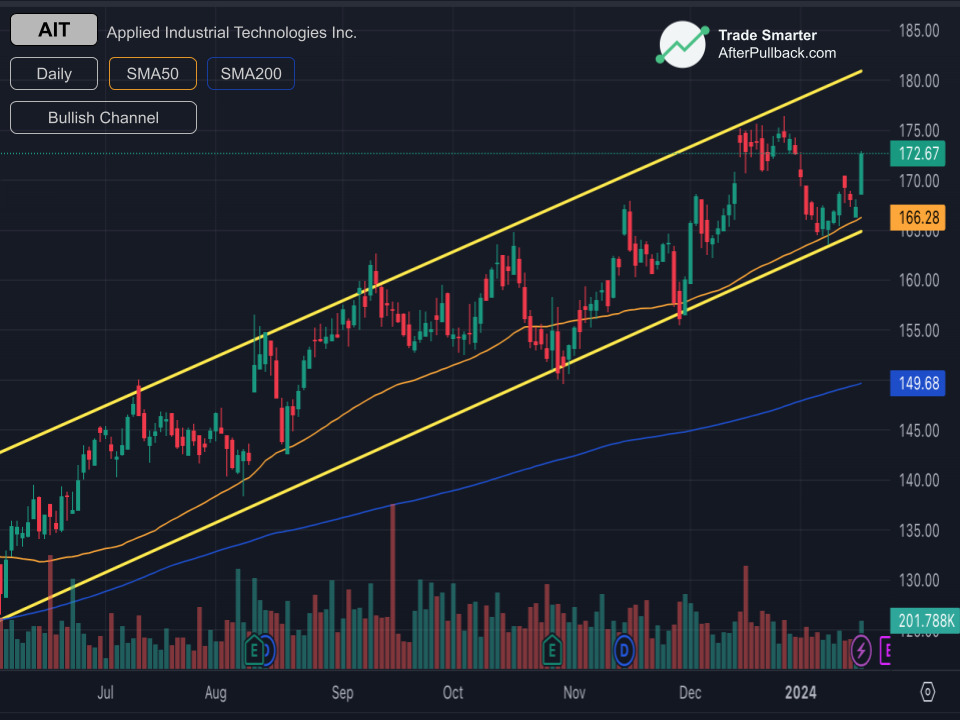
For Example, in a Price Channel Breakout, You can Identify a price channel formed by parallel trendlines connecting past highs and lows in the trend's direction (uptrend channel for uptrends, downtrend channel for downtrends). For Confirmation, Look for a breakout, where the price decisively closes above the channel (uptrend) or below the channel (downtrend). This breakout suggests a potential continuation of the trend with increased momentum creating an entry opportunity.
Similarly,
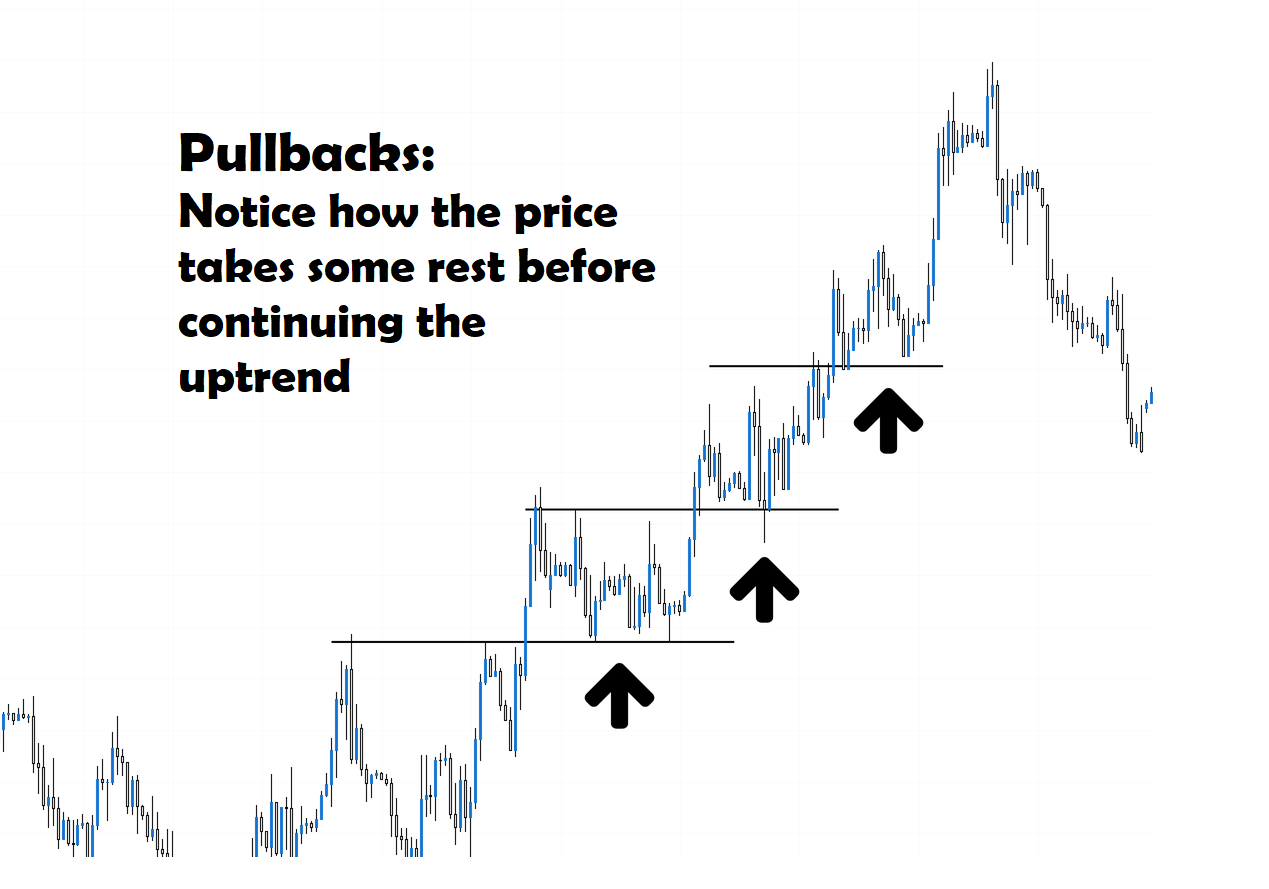
Uptrends naturally experience pullbacks (temporary price declines). You can look for the pullback to find support at a key level like a moving average or previous support zone. If the pullback holds and the price bounces back up, it can signal a buying opportunity within the continuing uptrend.
Moreover,
Fibonacci retracements are also a popular tool that identifies potential retracement zones based on historical price movements. So, In an uptrend, after a significant price move, a pullback might find support around Fibonacci retracement levels (e.g., 38.2%, 50%). These areas can be potential entry points for long positions anticipating the uptrend to resume.
And also,
You can find entry points based on Volatility Contraction.
Sometimes, trends are preceded by periods of low volatility (price movement). This can be a sign of pent-up buying or selling pressure. A sudden increase in volatility (expanding range) after a contraction can signal a potential breakout in the direction of the trend. This volatility increase might be a good entry point.
Step 3: Identify Exit Points
As with entry into trades, It is also very crucial to identify the exit points in a trending market . Here are some common approaches to achieving this
Target-Based Exits:
You can set profit targets based on a pre-determined risk-reward ratio (e.g., aiming to profit twice what you're willing to risk).
For a Confirmation Signal, you can look for signs of resistance in an uptrend (price struggles to move higher) or support in a downtrend (price struggles to move lower). This might indicate a potential trend slowdown or reversal.
You should also consider using indicators like overbought/oversold signals (RSI above 70) or trend divergence (price keeps rising but RSI starts to fall) to suggest potential profit-taking opportunities.
Stop-Loss based Exits
You should always use stop-loss orders to automatically exit the trade if the price moves against you, limiting potential losses. While stop-loss placement is crucial, confirmation signals can help with fine-tuning. You can do this while again looking at the Price Action. In an uptrend, consider placing a stop-loss below the most recent support level. A break below support might suggest a weakening trend or potential reversal causing the exits.
Some traders also use trailing stop-loss orders based on indicators like parabolic SAR, which automatically adjust as the price moves in your favor.
Exits based on Trend Reversal Signals
You should Exit if the trend seems to be reversing
For this, Look for a confirmed break below support in an uptrend or above resistance in a downtrend.
But,
Confirm this trend reversal first with a Confirmation Signal
Observe price action for follow-through after a potential trend break. A sustained move in the opposite direction strengthens the reversal signal.
You can use indicators like MACD crossovers (opposite to trend direction) or ADX weakening (trend strength declining) to confirm a potential trend reversal and exit the trade.
And Last, You can also set
Time-Based Exit
Some swing traders exit positions after holding them for a specific timeframe (e.g., few weeks or months). This approach can help lock in profits and avoid the risk of getting caught in a sudden trend reversal.
Step 4: Never Forget Risk Management
The market can be unpredictable, and even the most well-planned strategies can encounter losses- – risk management is the lifeline of a swing trader
One losing trade can significantly impact your account. Effective risk management helps you stay in the game by limiting potential losses on any single trade. Here are a couple of options to address this.
Position Sizing: This principle dictates how much capital you allocate to each trade. A common approach is to risk a fixed percentage of your total account capital per trade, typically between 1% and 2%. This prevents a single losing trade from wiping out your account. For example, with a $10,000 account and a 1% risk rule, your maximum risk per trade would be $100.
Diversification: We have emphasized this enough in these pages, And we say it again. Spread your capital across different assets within the trend you're following (e.g., stocks in various sectors) or even consider different trends altogether. This diversification helps reduce your overall risk exposure. Imagine a strong uptrend in the tech sector, but a sudden downturn in that specific industry. By having positions in other trending sectors, the impact on your portfolio would be lessened.
Bonus Tip: Putting the Pieces Together - A Sample Scenario
As a bonus tip, here's a fictional example to illustrate how you might apply this swing trading strategy with a trend-following approach:
Imagine you're analyzing a technology stock (TechCo) and suspect an uptrend is underway.
Identifying the Trend: You review the chart and notice a series of higher highs and higher lows over the past few months, confirming an uptrend. Additionally, the 50-day MA is consistently above the 200-day MA, further strengthening the uptrend indication.
Entry Point: You identify a support level around $50 per share, where the price has previously bounced back in the uptrend. You might also consider using the RSI indicator, aiming to enter near oversold territory (below 30) for a potential buying opportunity.
Confirmation Signal: The RSI dips below 30, potentially signaling an oversold condition. This coincides with the price nearing the $50 support level.
Risk Management: You decide to allocate 1% of your capital (e.g., $100 for a $10,000 account) to this trade and place a stop-loss order below the $50 support level to limit potential losses.
Exit Point: You have two options for exiting the trade:
· Profit Target: You might set a profit target based on a risk-reward ratio (e.g., aiming for a 2:1 ratio, targeting a $20 profit per share after entering at $50).
· Technical Indicator: Alternatively, you could utilize a trailing stop-loss that automatically adjusts as the price moves in your favor, potentially following an indicator like the parabolic SAR.
In conclusion,
Swing trading with a trend-following approach offers a way to potentially capitalize on market movements over days or weeks. By understanding how to identify trends, utilize technical analysis for entry and exit points, and prioritize risk management, you can increase your preparedness for the markets.
Trade Smarter!


