How to do swing trading in volatile markets

On February 2nd, 2024, Meta Platforms (formerly Facebook) experienced its largest single-day stock market loss in history. However, the following day, the company recovered significantly, with its stock price jumping over 26% in a single day. This rebound was likely due to positive investor sentiment following strong earnings reports and stock buybacks and dividends announcements."
This is a classic textbook example of why ignoring Volatility can be a costly mistake. As Swing traders, you must consistently look beyond the immediate headlines to take advantage of Volatility.
And that is the reason for making this blog!
In this blog, we'll discuss the knowledge and Trading strategies to navigate the volatile markets, identify potential opportunities, and manage risk effectively
Let's Start with the question,
What is So Special about Market Volatility?
See, Volatility is an amazing feature of the market.
Let's say you have a stock that typically moves $1 per day. In a volatile market, that same stock might experience a $3 swing, allowing a skilled swing trader to triple their profits compared to a normal market, potentially
However, this increased potential for gain comes with a hefty price tag:
Heightened risk.
The same dramatic price swings that offer lucrative opportunities can also inflict substantial losses if they move against your position. Just as a stock can surge $3 in a volatile market, it can also plummet by the same amount, amplifying potential losses.
So,
For Swing traders, it becomes necessary to understand this inherent risk-reward volatility dynamic. While the potential rewards can be tempting, it's crucial never to let that overshadow the increased risk.
Experienced Swing Traders divide these Volatile Market trading Strategies into two separate classes.
· High Volatile Markets
· Low Volatile Markets
We discuss both of them below;
1) High Volatile Markets
Before we move on to discuss the strategies,
Lets first understand
What are some examples of Highly Volatile Markets
The First Example of a High Volatile Market is Currency Markets (Forex)
The Forex market is known for its 24-hour trading and significant daily price swings. Economic data releases, interest rate changes, and geopolitical tensions can cause rapid currency fluctuations.
For Example, A central bank raising interest rates unexpectedly could strengthen a currency, leading to significant price swings against other currencies.
Similarly,
Commodities like oil, gold, and agricultural products are often subject to volatile price swings due to supply chain disruptions, weather events, and geopolitical conflicts.
The same goes for the Emerging Markets!
Stocks and currencies in developing economies can be more volatile than those in developed markets. Political instability, economic reforms, and currency fluctuations can all contribute to this Volatility.
For Example, A sudden change in government leadership in an emerging market could trigger a sell-off in its stock market.
And,
Stock Markets themselves During some events can also become volatile.
Major news events, such as earnings reports, product launches, or mergers and acquisitions, can cause significant Volatility in individual stocks or entire market sectors.
For Example, A company missing its earnings expectations could sharply drop its stock price.
And last,
Cryptocurrencies
The cryptocurrency market is still relatively young and unregulated, making it highly susceptible to Volatility. News, social media sentiment, and celebrity tweets can cause significant price swings.
For Example, A negative regulatory announcement from a major government could cause a broad sell-off in the cryptocurrency market.
What are the trading strategies for these volatile markets
Ok,
So, one of the most common and core strategies for Swing traders is
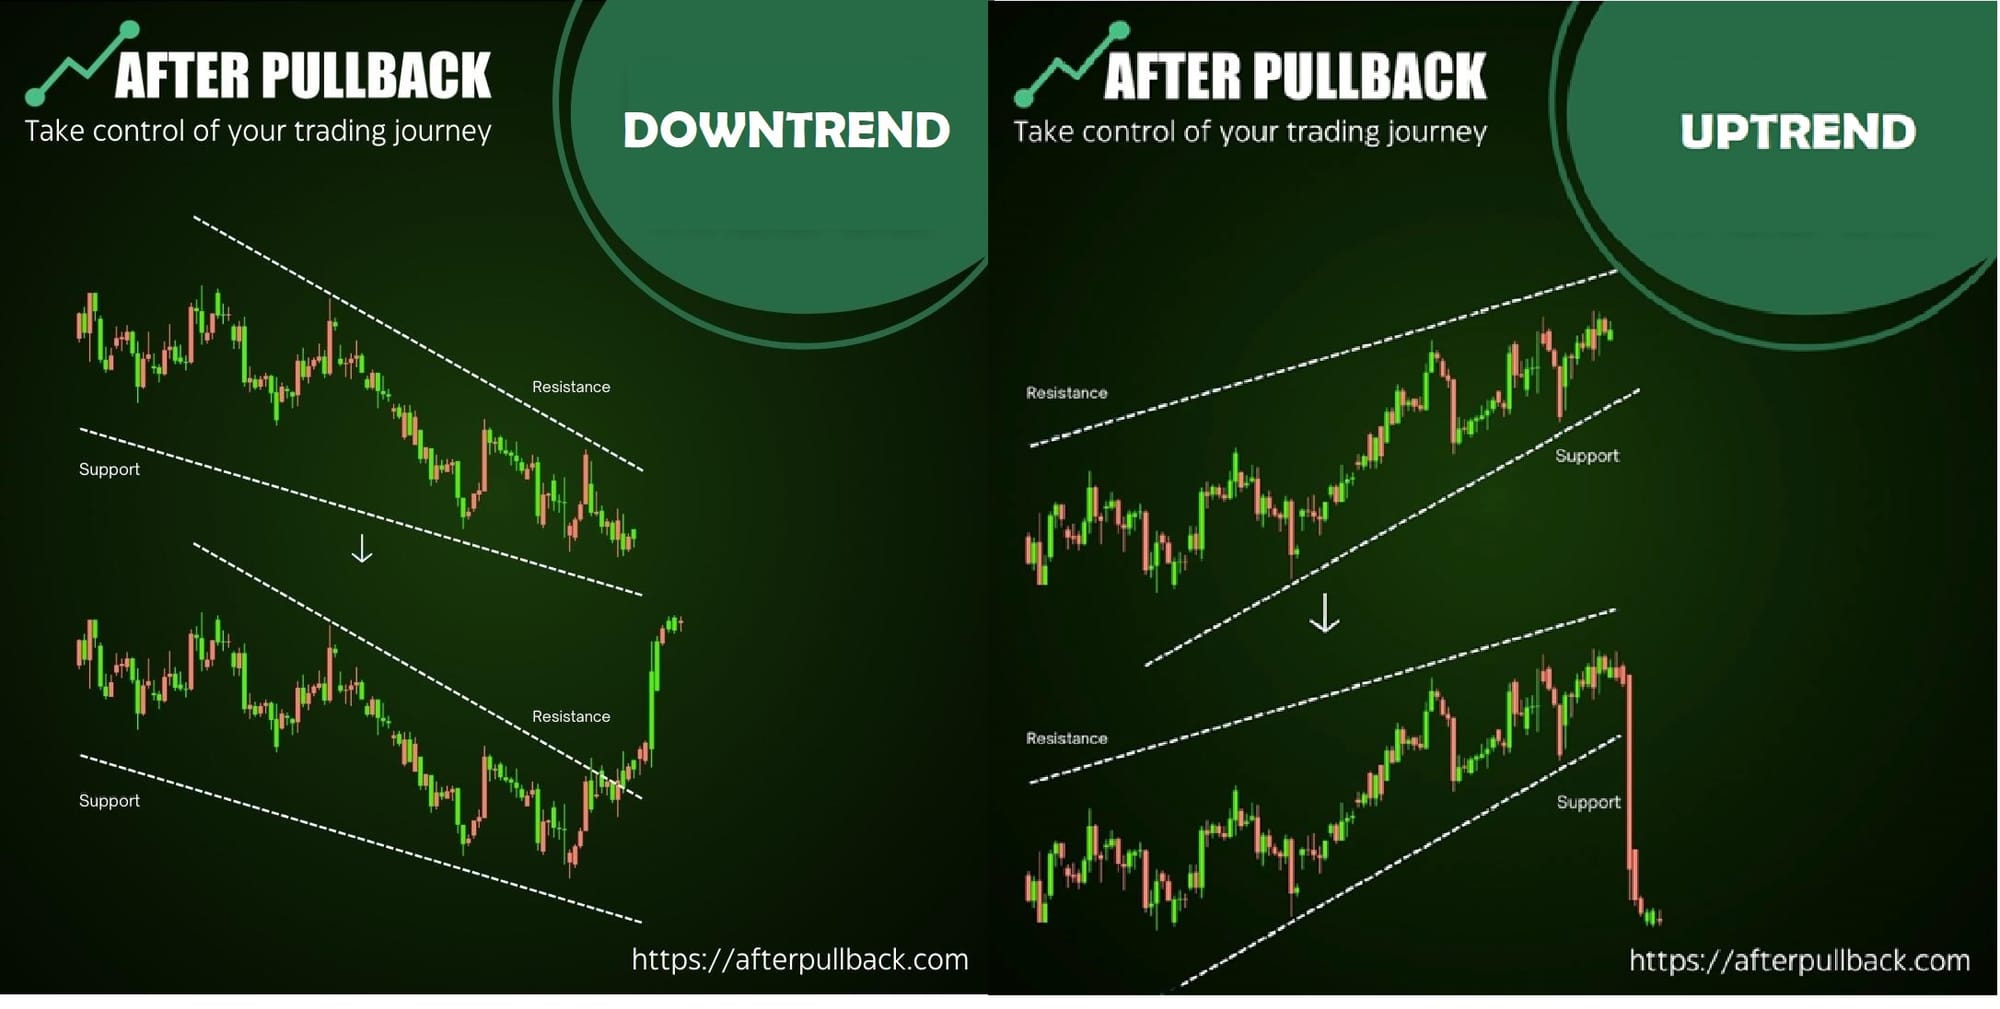
and it becomes even more crucial during volatile markets. The basic idea is to identify the prevailing trend (uptrend or downtrend) and align your positions to capitalize on solid price movements.
And How do you do it?
It starts with Trend Identification. Technical analysis tools like moving averages, trendlines, and momentum indicators can help you identify the direction of the trend.
When the market is in an uptrend, you will look for opportunities to buy stocks that are showing strong upward momentum. This could involve buying long positions (purchasing a stock outright) or buying call options (contracts that profit if the stock price rises).
Similarly,
During a downtrend, you look for opportunities to profit from falling prices. This could involve shorting stocks (borrowing and selling a stock with the expectation of repurchasing it later at a lower price) or buying put options (contracts that profit if the stock price falls).
Let's take an example,
Imagine a scenario during a recession. Many stocks will likely experience a downtrend as companies face economic challenges.
Using technical analysis, A swing trader employing this Strategy could Identify the Downtrend in a particular stock. Once identified, they decide to shorten the stock, anticipating its price will continue to fall. This allows them to profit even if the overall market remains volatile potentially.
They can also consider an Alternative Approach. They could also consider buying put options on the stock. This offers the potential for profit if the stock price falls but with a defined risk limited to the premium paid for the options contract.
Next Up Is
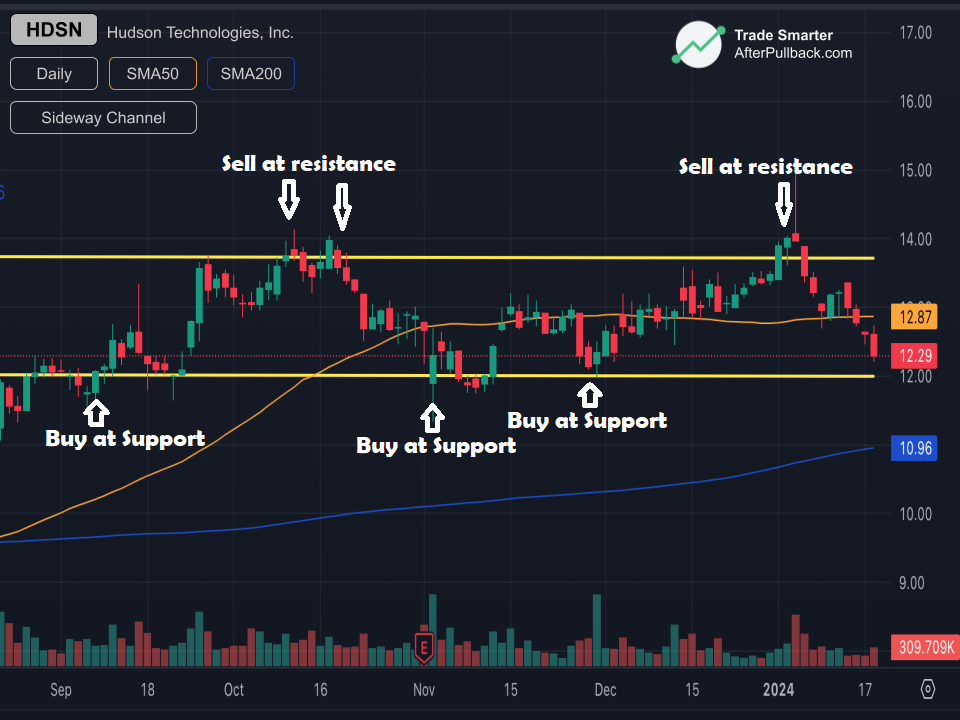
Range Trading
The Range Trading strategy exploits price movements within a well-defined range captured by support and resistance levels. By understanding these levels, you can position yourself to buy near support and sell near resistance.
And how do you do this?
Technical analysis tools like horizontal lines, trendlines, and price channels help identify these key levels. Support represents areas where the price tends to find buyers and bounce back up, while resistance represents areas where the price faces selling pressure and gets rejected.
Once you've established the range, you can place buy orders near support in anticipation of a price bounce.
Conversely,
you would place sell orders near resistance, aiming to profit as the price gets rejected and falls back down.
All right, so another promising strategy for swing traders is
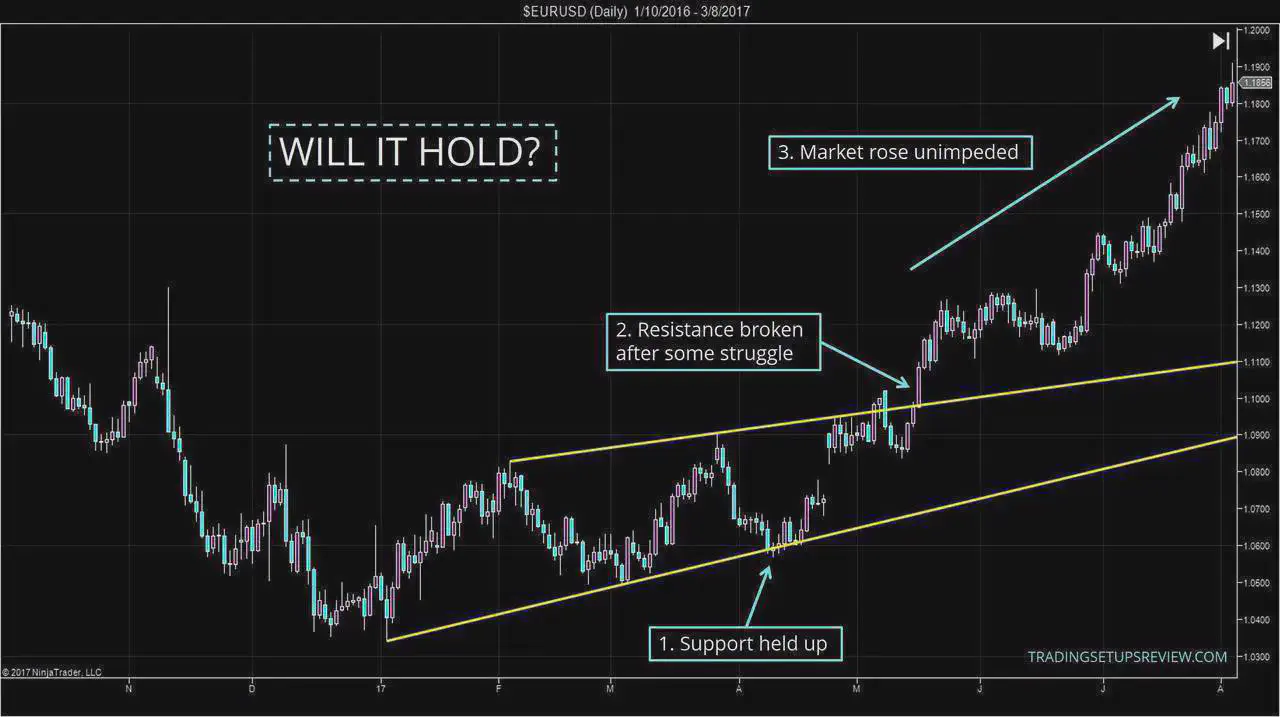
Breakout Trading:
The Breakout Trading Strategy hinges on identifying and capitalizing on price breakouts from established support or resistance levels. These breakouts signal a potential shift in the underlying trend, allowing you to ride the wave of a new price movement.
But, How to Identify a Breakout?
Solid technical analysis is key here. You'll be looking for price action testing and potentially breaking through established support or resistance levels with increased volume. Higher volume during a breakout suggests stronger conviction behind the price movement.
Once identified,
It's time to take action!
A breakout above resistance can signal a potential uptrend. A swing trader might enter a long position (buying the stock outright) or call options (contracts that profit if the stock price rises) to capitalize on the potential rise.
Conversely,
A breakout below the support might indicate a downtrend, prompting a short position (borrowing and selling a stock) or put options (contracts that profit if the stock price falls).
But,
Here is a word of Caution for the breakouts!
Breakouts aren't guaranteed to lead to sustained trends. False breakouts can occur when the price breaks a level but quickly reverses. Always prioritize risk management with stop-loss orders to limit potential losses if the breakout fails.
2) Low-Volatile Markets
Low volatility markets can feel frustrating for swing traders used to big swings and quick profits. However, there are still strategies to capitalize on smaller price movements.
But before moving on to those strategies, Let's first understand,
What are some examples of Low Volatile Markets
Low volatility markets, while potentially less exciting for swing traders, can still offer opportunities for profit with a more measured approach. Some examples of asset classes or situations that tend to exhibit lower Volatility:
The first one is,
Consumer Staples Stocks. Companies that sell essential goods like food, beverages, and household products tend to experience steadier sales and profits regardless of economic conditions. This translates to lower price swings in their stocks compared to more cyclical companies.
Companies like Coca-Cola (K.O.) or Procter & Gamble (P.G.) typically exhibit lower Volatility than stocks in more volatile sectors like technology or financials.
Similarly,
Utility companies provide essential services like electricity, water, and gas. Their revenue streams are often regulated, and demand for their services remains relatively stable.
This stability translates to lower price volatility in their stocks.
Also
Government Bonds, especially those issued by developed nations with solid credit ratings, are considered relatively safe investments. Their prices fluctuate less than stocks or corporate bonds due to their lower risk profile and fixed income payments.
U.S. Treasury bonds are a prime example of low-volatility assets. While their price movements exist, they tend to be smaller and more predictable than stocks.
Ok,
Now, you may know what markets are considered low volatile.
It's an excellent time to consider
Trading Strategies for Low-Volatile Stocks
So, If the price doesn't show much Volatility, you can still use strategies such as
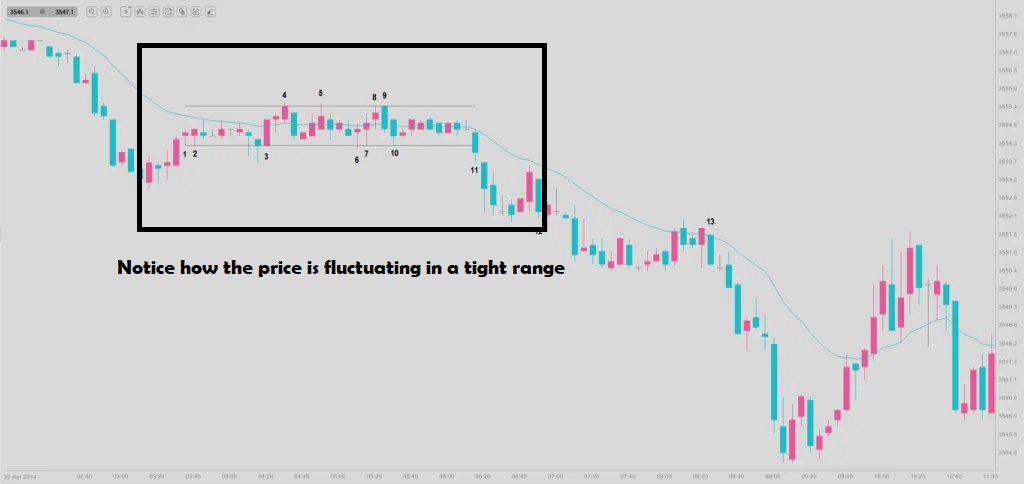
Tight Range Trading
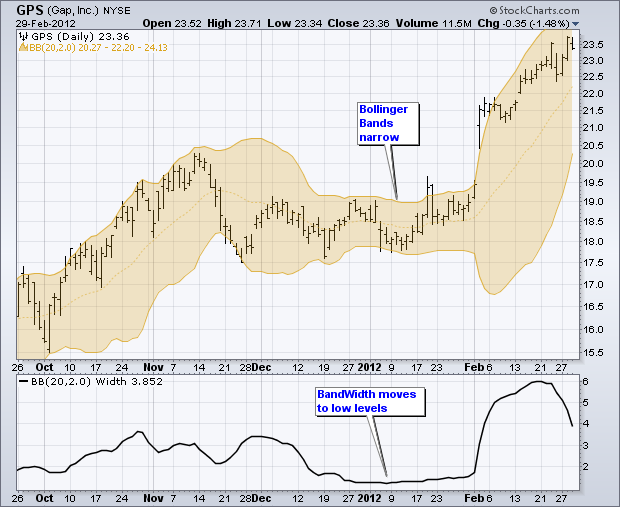
There is a stock price hovering within a very tight range, indicative of a period of low Volatility. Due to the limited price swings, regular range trading might need help to generate significant profits. This is where tight-range trading comes in. By focusing on this narrow channel, you can capture even the smallest price movements within the range and accumulate profits over time.
And how do you identify these tight ranges?
Technical analysis tools like Bollinger Bands become instrumental here. Bollinger Bands visually represent Volatility, with the bands contracting when Volatility is low and expanding when Volatility increases. Tightly compressed Bollinger Bands® can indicate a potential tight trading range.
But wait,
While Bollinger Bands are a good starting point, it's wise to combine them with other technical indicators like Relative Strength Index (RSI) or Average True Range (ATR) to confirm the presence of a tight range and filter out potential false signals.
Once you've identified a well-defined tight range, your Strategy revolves around placing buy orders near support and sell orders near resistance. Since the price movements are more minor, precise entry and exit points become even more crucial.
There is one more very interesting Strategy for low-volatile stocks
It is called Volatility Contraction Strategy
Experienced swing traders understand that Volatility, while sometimes emotionally draining, is a natural part of the market.
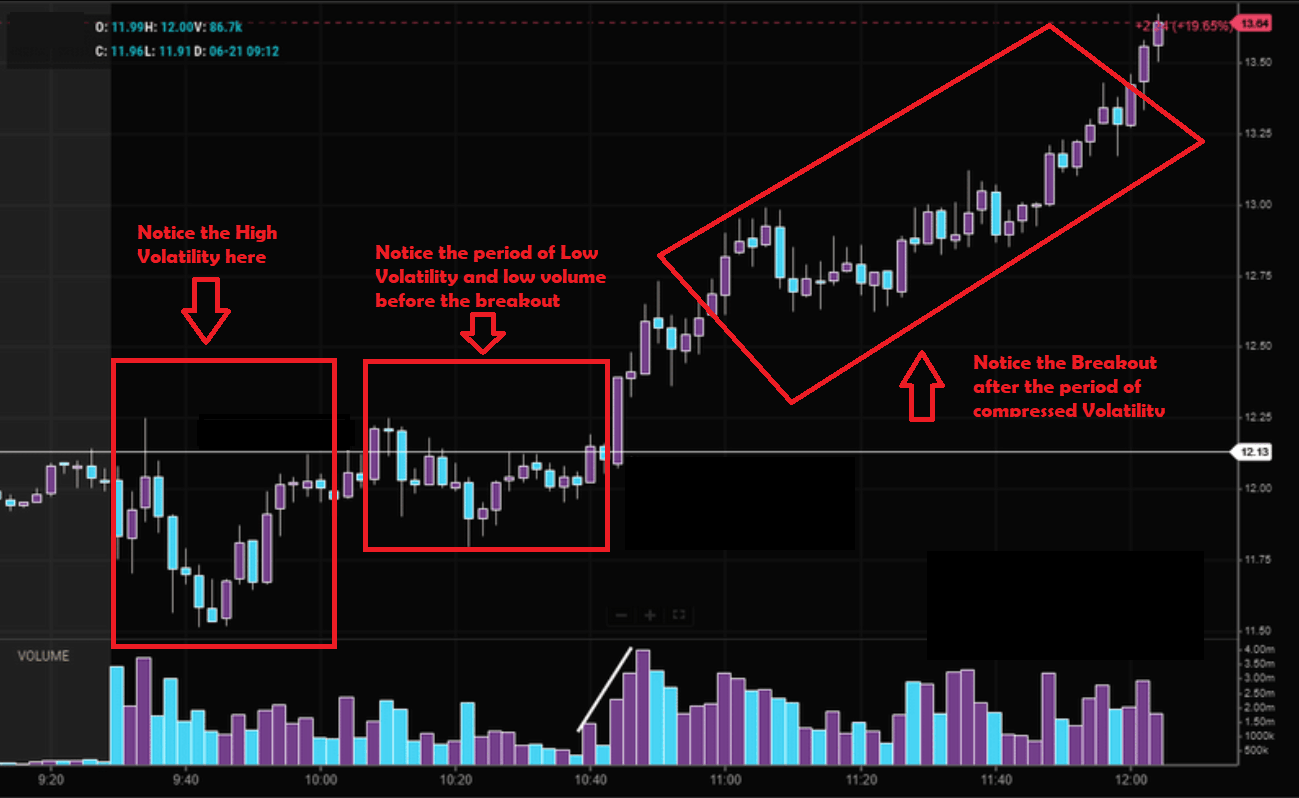
Volatility Contraction Strategies capitalize on this by identifying assets with a history of high Volatility who are currently experiencing a period of unusual calm. The underlying idea is that this compressed Volatility is temporary, and when it inevitably expands, the asset is likely to experience more significant price swings, presenting potential swing trading opportunities.
The Strategy begins by Identifying Historically Volatile Assets. This could involve researching stocks or currency pairs known for significant price fluctuations in the past. Technical analysis tools like Average True Range (ATR) can also help identify assets with historically high Volatility.
Once you've identified a historically volatile asset, monitor its current price action. Look for periods with unusually tight price ranges and low trading volume, which might suggest a temporary lull in Volatility.
And then
Preparing for the Breakout!
While you can't predict the exact timing, thorough research and technical analysis can help you anticipate a potential return of Volatility. This is where you develop a swing trading plan based on your chosen Strategy (e.g., breakout trading, trend following) to capitalize on the expected price swings.
An Example of this Strategy can be seen in the foreign exchange market (Forex). A currency pair like USD/JPY (U.S. Dollar vs. Japanese Yen) is known for its historical Volatility. A swing trader employing this Strategy will search for a chart that reveals an unusually tight trading range for USD/JPY, with low trading volume, suggesting a period of compressed Volatility. Once found, They might develop a breakout trading strategy, placing buy or sell orders near the edges of the current range in anticipation of a breakout that could lead to larger price movements.
Conclusion:
Swing trading in volatile markets, while inherently riskier, offers the potential for amplified profits compared to calmer periods. However, to navigate this effectively, a swing trader must equip themselves with the knowledge and strategies to exploit these opportunities while managing risk.
Remember, successful swing trading hinges on a combination of sound strategy, thorough market analysis, and disciplined risk management. By applying these principles, you can position yourself to capitalize on the opportunities that market volatility presents.
Trade Smarter!