How to Boost Your Trading Performance by Trend Identification?
Have you also noticed that some traders consistently outperform the rest?
The answer is that they may have a powerful skill
Trend identification!
Through this tool and understanding the underlying direction of the market, you can also make informed trading decisions and maximize your profits.
Therefore,
In the blog post below, we will equip you with the knowledge and strategies to identify trends and boost your overall trading performance confidently.
So, Let's Start with the most basic question first
What is a Trend?
In trading, a trend is the overall direction in which the price of a security (stock, forex, commodity, etc.) or market moves over a specific period.
Based on Directions, Trends can be upward (Uptrend), downward (downtrend), or sideways (consolidation).
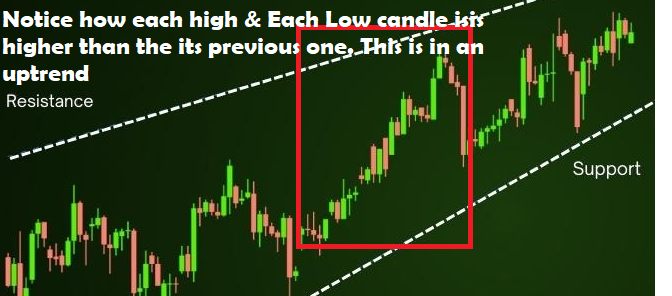
Uptrend:
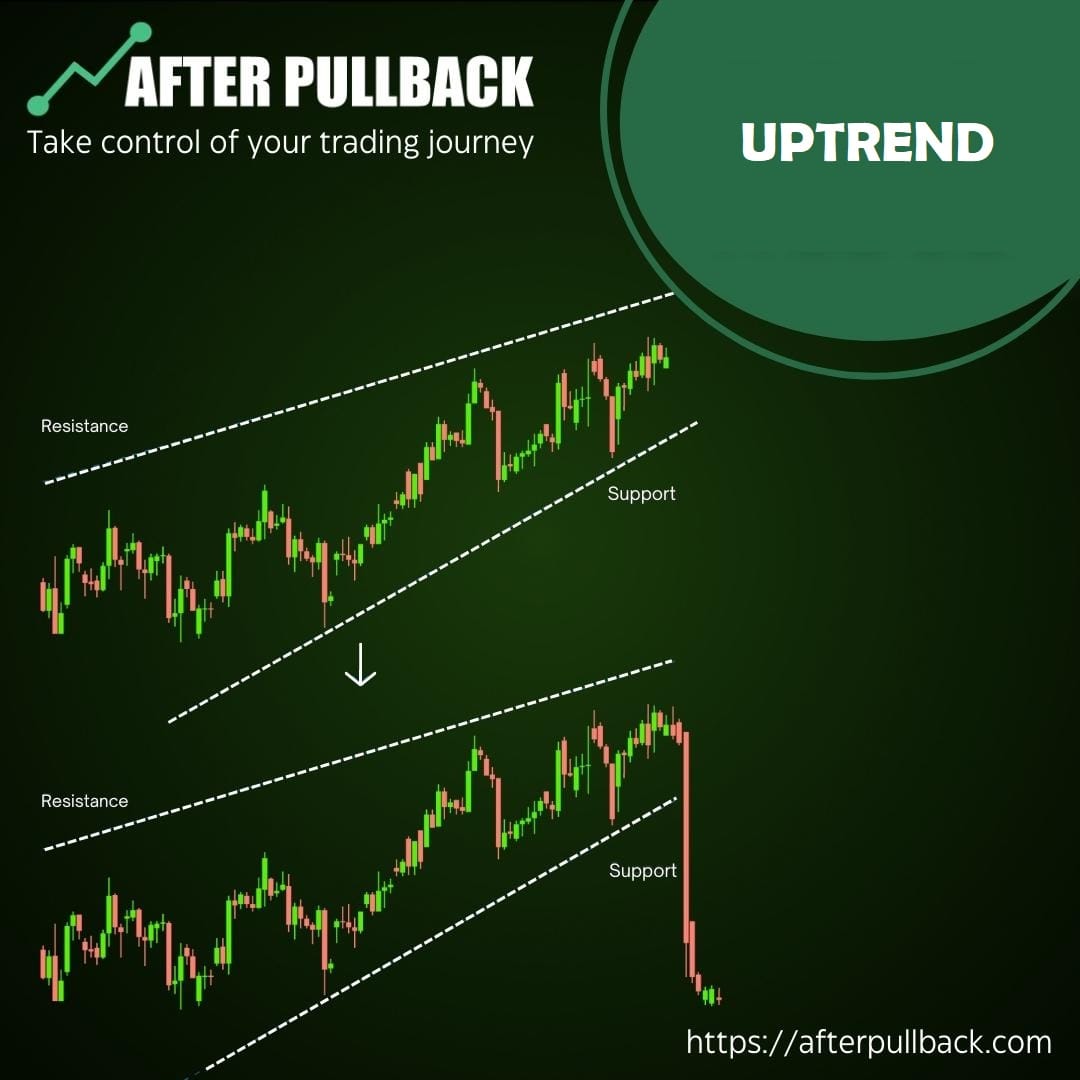
In Uptrends, the price makes higher highs (peaks) and higher lows (troughs) over time. This signifies sustained buying pressure in the market, pushing the price generally upwards.
This is the same as a staircase going upwards. Each step represents a swing (high and low) in price, with each new high being higher than the previous high and each new low being higher than the previous low.
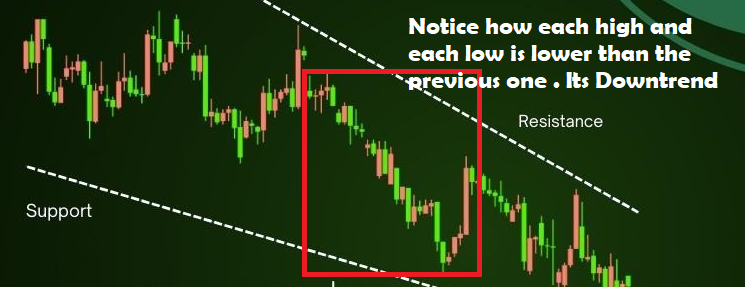
Downtrend:
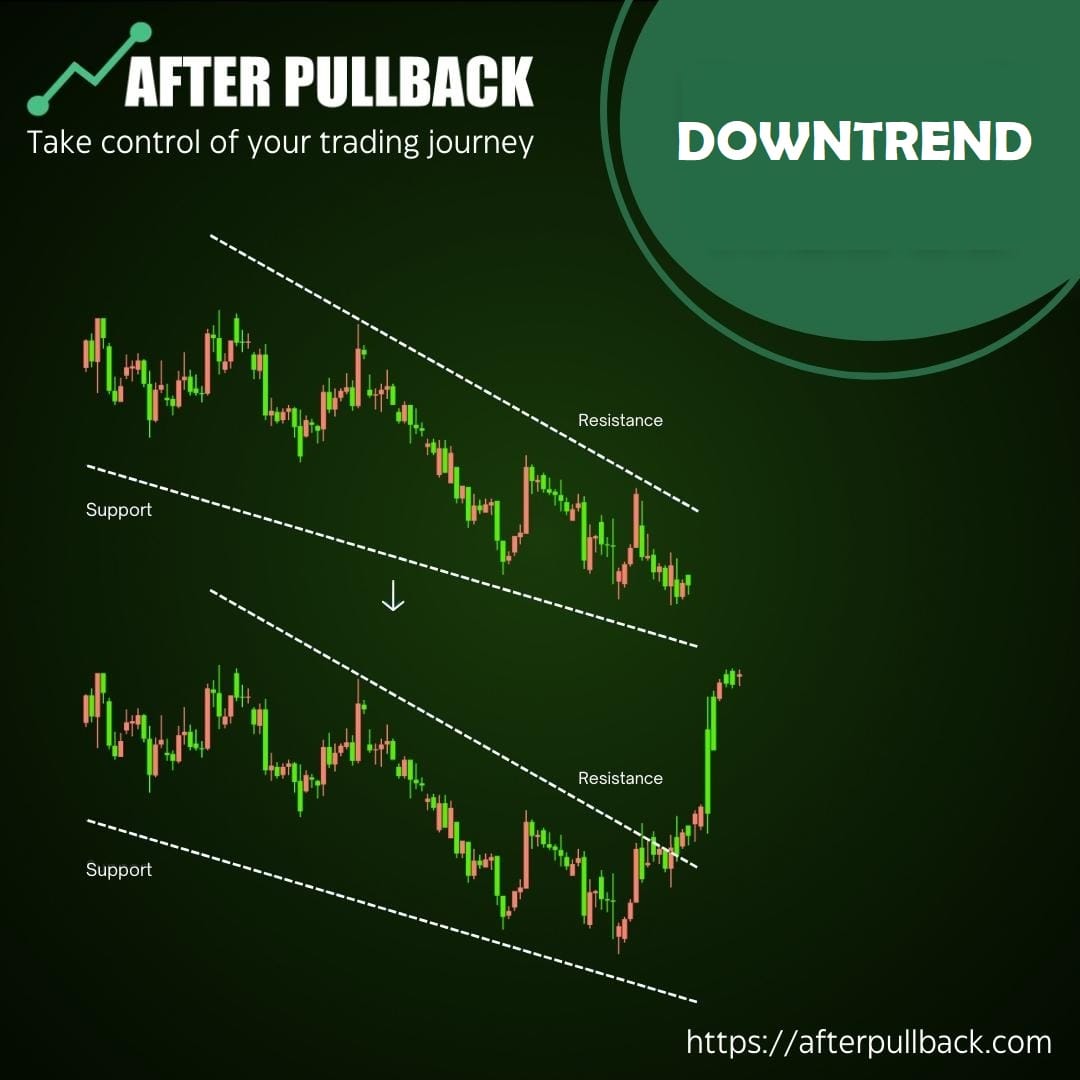
In the downtrend, the price makes lower highs (peaks) and lower lows (troughs) over time. This signifies that selling pressure dominates the market, pushing the price generally downwards.
Like the Uptrend, a Downtrend can be imagined as a descending staircase. Each step represents a swing (high and low) in price, with each new high being lower than the previous high and each new low being lower than the previous low.
How to Identify a Trend?
Identifying trends is a fundamental skill for any trader, as it can help you spot potential trading opportunities and make informed decisions.
Traders often use different mechanisms to identify trends;
Identification of Trends through Price Action;
Price Action is the foundation of many technical analysis approaches. It involves analyzing the raw price movements, focusing on the sequence of highs and lows. By observing price patterns and candlestick formations, you get to know the market sentiment and potential trends
 Imran Haider
Uptrend: Look for higher highs (peaks) and higher lows (troughs). Each subsequent high should be higher than the previous high, and each low should be higher than the previous low. This sequential progression visually confirms an uptrend.
Downtrend: Conversely, in a downtrend, you'll see a series of lower highs and lower lows. Each subsequent high should be lower than the previous high, and each low should be lower than the previous low.
Trend Lines: You can visualize the overall price direction by connecting the highs (Uptrend) or lows (downtrend) with a trend line. A broken trend line can signal a potential trend reversal.
Identifying Key Levels:
Price action analysis focuses heavily on identifying support and resistance levels, which are price zones where the market has previously had difficulty breaking through.
Support is an area on the chart where the price has bounced back up previously. It suggests that buying pressure might be strong in that zone, potentially halting or reversing a downtrend.
Resistance: An area on the chart where the price has been rejected previously. Selling pressure might be strong in that zone, potentially halting or reversing an uptrend.
You can gauge the trend's strength by observing how the price interacts with these support and resistance levels. A clean break above resistance in an uptrend or below support in a downtrend can signal a continuation of the trend. Conversely, a struggle to break these levels might indicate a potential trend reversal.
Candlestick Patterns:
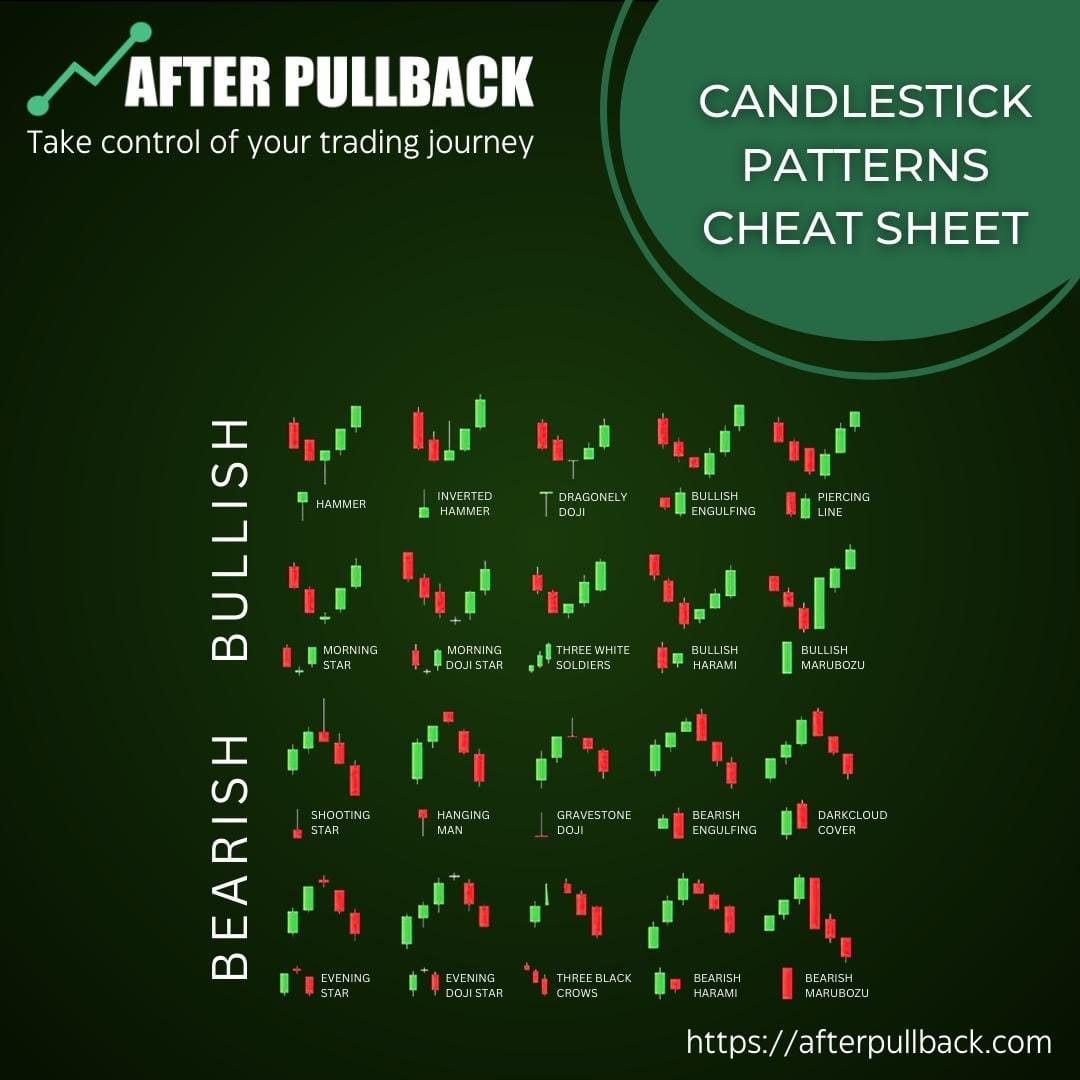
Price action analysis also heavily utilizes candlestick patterns, which are specific formations created by a security's open, high, low, and close prices within a given timeframe (e.g., daily, hourly). These patterns can offer clues about market psychology and potential trend direction. Here are a few common examples:
Hammer and Inverted Hammer: These patterns can signal a potential trend reversal at the end of a downtrend (hammer) or Uptrend (inverted hammer).
Engulfing Bars: A bullish engulfing bar occurs when a bullish candlestick completely engulfs the body of the previous bearish candlestick, suggesting a potential trend reversal from downtrend to Uptrend. A bearish engulfing bar follows the opposite logic.
Doji: Doji candlesticks with small bodies and long shadows represent indecision in the market. Depending on their location on the chart, they might indicate a potential trend pause or reversal.
Combining Price Action with Other Techniques:
While price action analysis offers a powerful window into market sentiment and potential trends, it's important to remember that the financial markets are complex ecosystems. Relying solely on price action can leave you vulnerable to false signals and unexpected market movements. To indeed strengthen your trend identification and make more informed trading decisions, consider incorporating these additional technical analysis tools alongside price action:
Trend Lines:
You create a visual representation of the overall price direction by connecting the highs (Uptrend) or lows (downtrend) with a trend line. Price action interacting with these lines can validate a trend's strength or potential reversal.
· Breakouts: A clean break above a trend line in an uptrend or below a trend line in a downtrend, supported by solid price action, can signal a continuation of the trend with increased confidence.
· Retests: Sometimes, after a breakout, the price might revisit the trend line briefly before continuing the trend. Observing how price action reacts to these retests using rejection candlesticks or substantial buying/selling volume can solidify your conviction in the trend's direction.
Imran Haider
Volume Analysis:
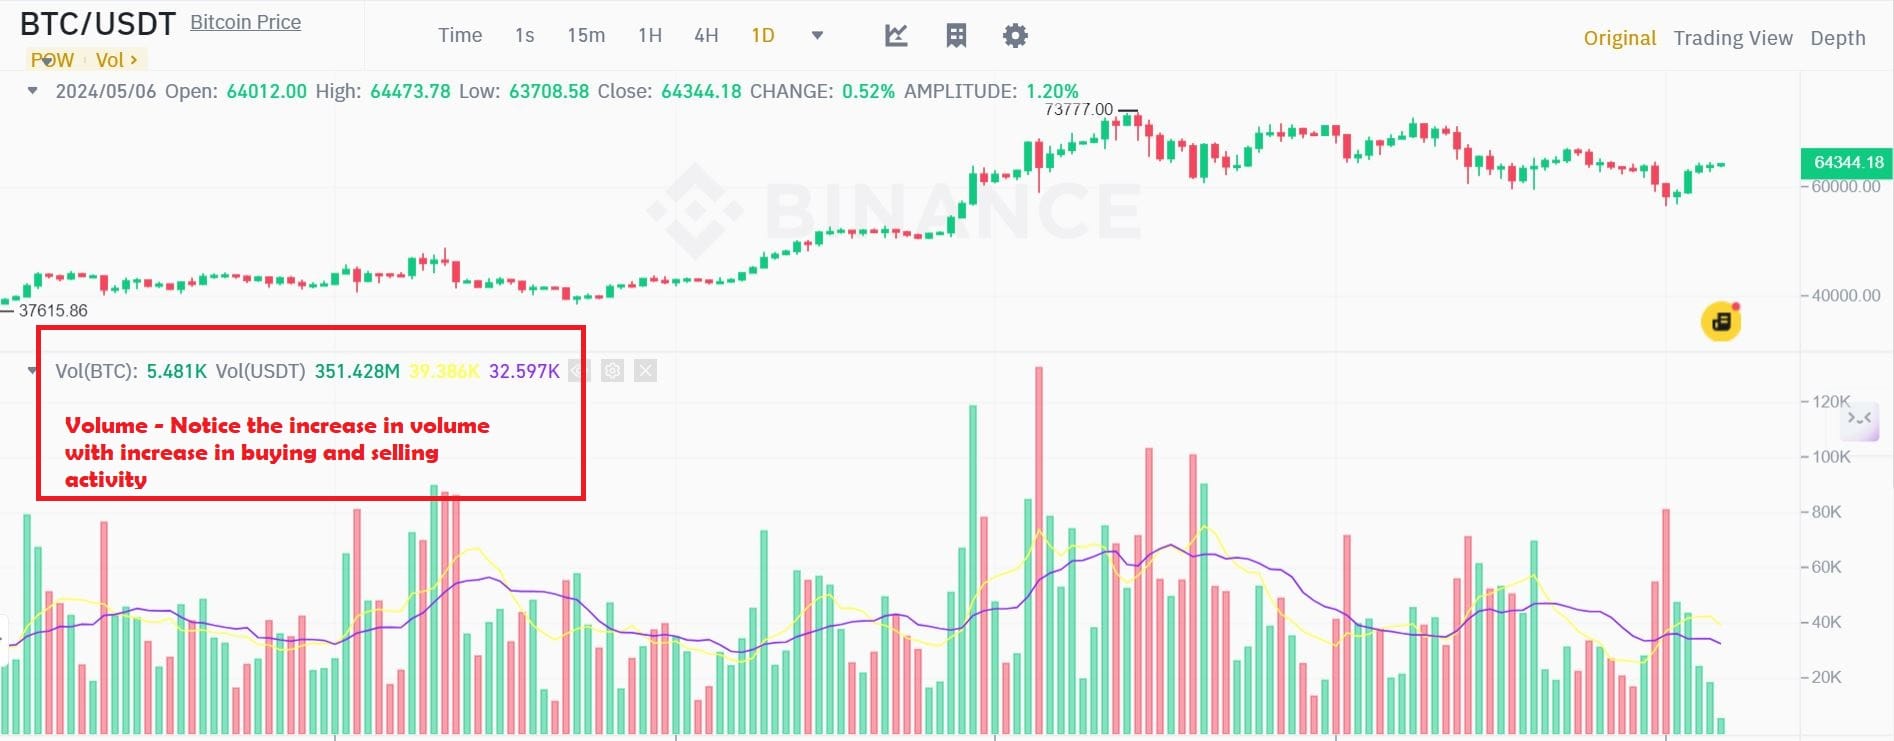
Price action analysis focuses primarily on price movements. However, volume, representing the number of shares or contracts traded within a timeframe, can offer additional insights.
· Rising volume alongside rising prices in an uptrend can indicate strong buying pressure and a trend continuation. Conversely, declining volume alongside rising prices might suggest weakening momentum and a possible trend reversal.
· Heavy volume on a breakout above resistance or below support can strengthen the confirmation of a trend change.
Moving Averages (MAs):
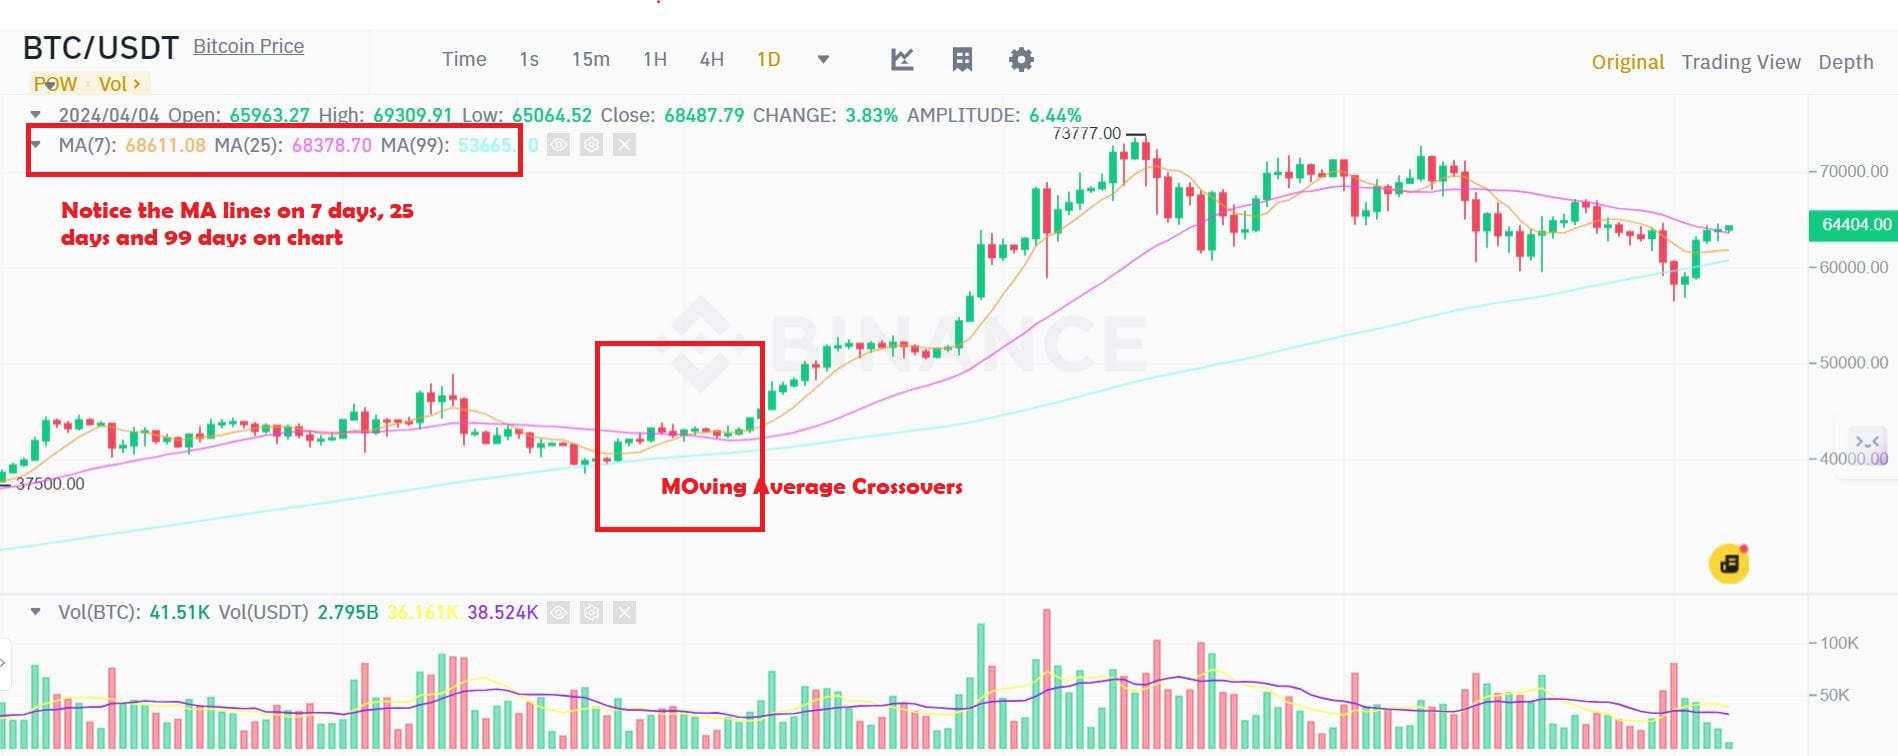
Moving averages are a great tool to smooth out price fluctuations. This is done by calculating the average price over a chosen period (e.g., a 50-day MA or 200-day MA). They act as a trend filter, highlighting the underlying direction by removing short-term noise.
Identifying Trends: A rising moving average, especially when accompanied by rising prices, indicates a potential uptrend. The uptrend signal becomes stronger as the slope becomes steeper.
Conversely,
A falling moving average, especially when accompanied by falling prices, suggests a potential downtrend. The signals becomes stronger as the slope becomes steeper.
Moreover,
A Corssover of a shorter-term moving average crosses above a longer-term moving average can signal a trend change. For example, a 50-day MA crossing above a 200-day MA might indicate a shift from a downtrend to an uptrend. The opposite crossover (shorter-term MA falling below longer-term MA) can suggest a trend reversal from Uptrend to downtrend.
Relative Strength Index (RSI):
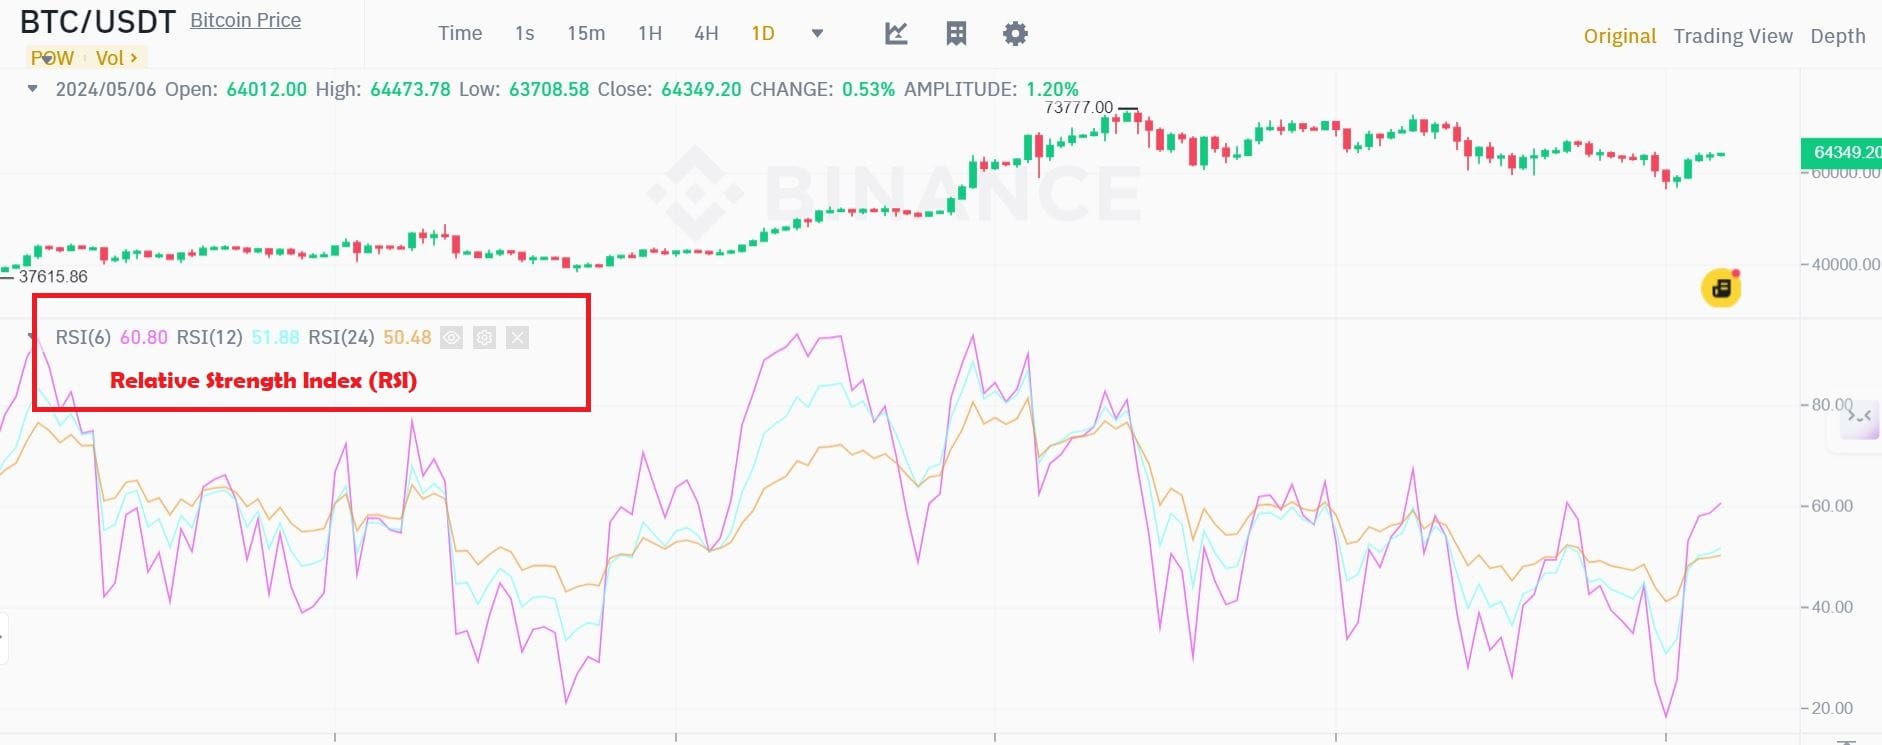
The RSI measures the momentum of price movements by comparing the average of recent gains to the average of recent losses. It typically ranges from 0 to 100.
Generally, an RSI reading above 70 suggests the market might be overbought (prices may be due for a correction), while a reading below 30 suggests the market might be oversold (prices may be due for a rebound). However, these are not strict thresholds, and the interpretation can vary depending on the market context.
So,
How do you confirm the trend with RSI?
The RSI should stay consistently above 50 in an uptrend, indicating ongoing buying pressure. Conversely, the RSI should stay below 50 in a downtrend, indicating selling pressure.
Moving Average Convergence Divergence (MACD):
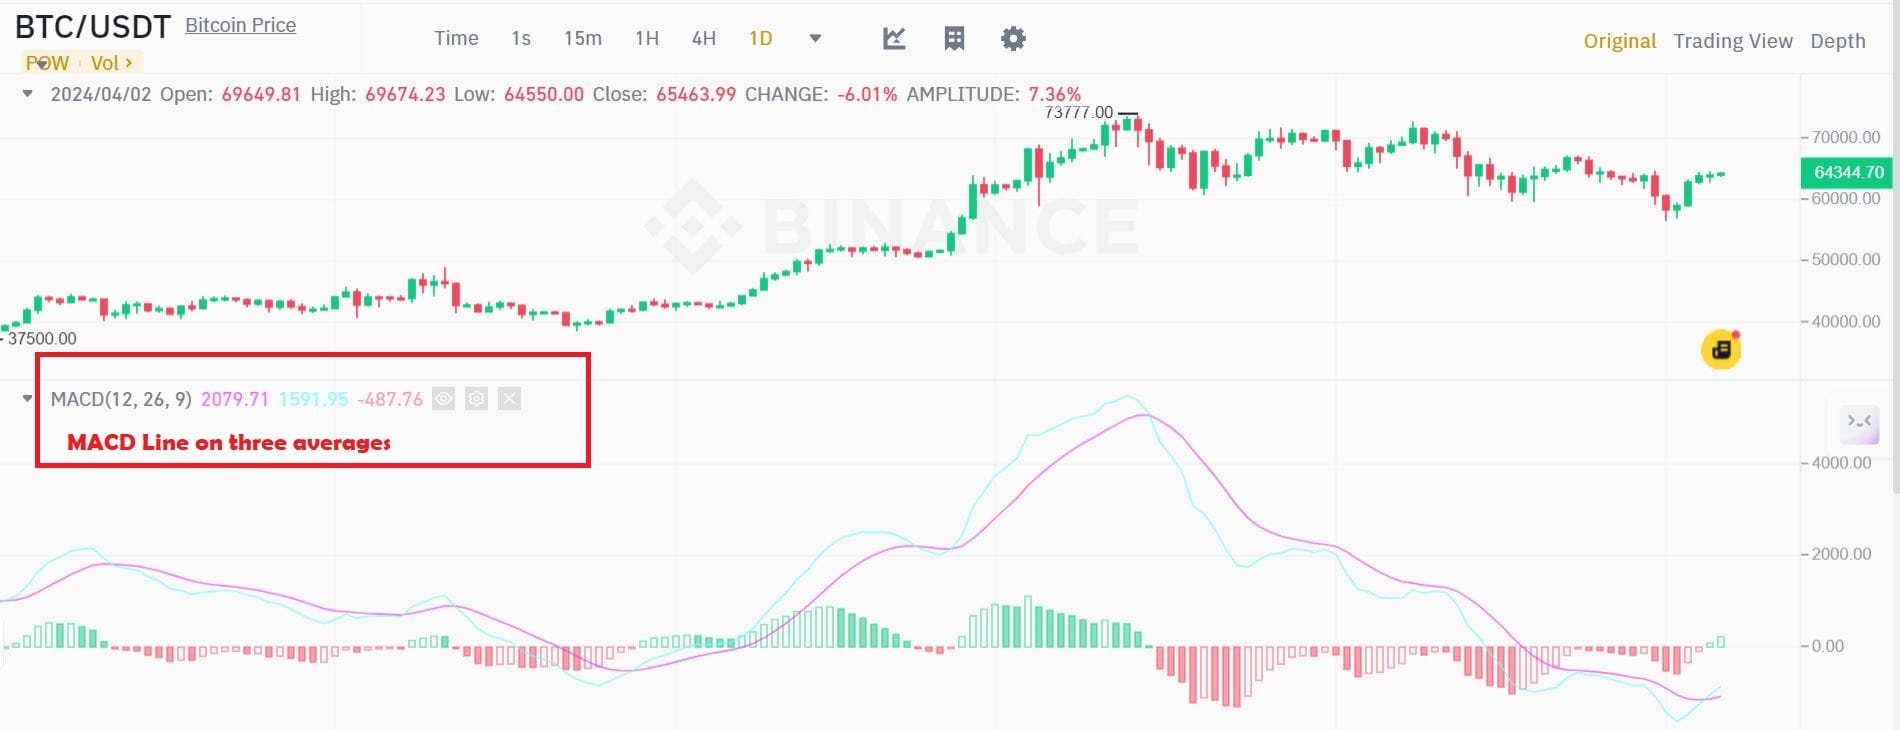
The MACD is a trend-following momentum indicator that combines two moving averages (a longer-term MA and a shorter-term MA) and a signal line (a moving average of the MACD itself).
How to Identify Trends with MACD
A crossover above the signal line by the MACD line can signal a potential uptrend, especially if accompanied by rising prices. Conversely, a crossover below the signal line by the MACD line can signal a potential downtrend, especially if accompanied by falling prices.
Similarly,
A divergence between the MACD line and the price action can sometimes warn of a potential trend reversal. For example, if the price keeps making new highs but the MACD line fails to follow suit (bearish divergence), it might suggest the Uptrend is losing momentum.
Volume-Weighted Average Price
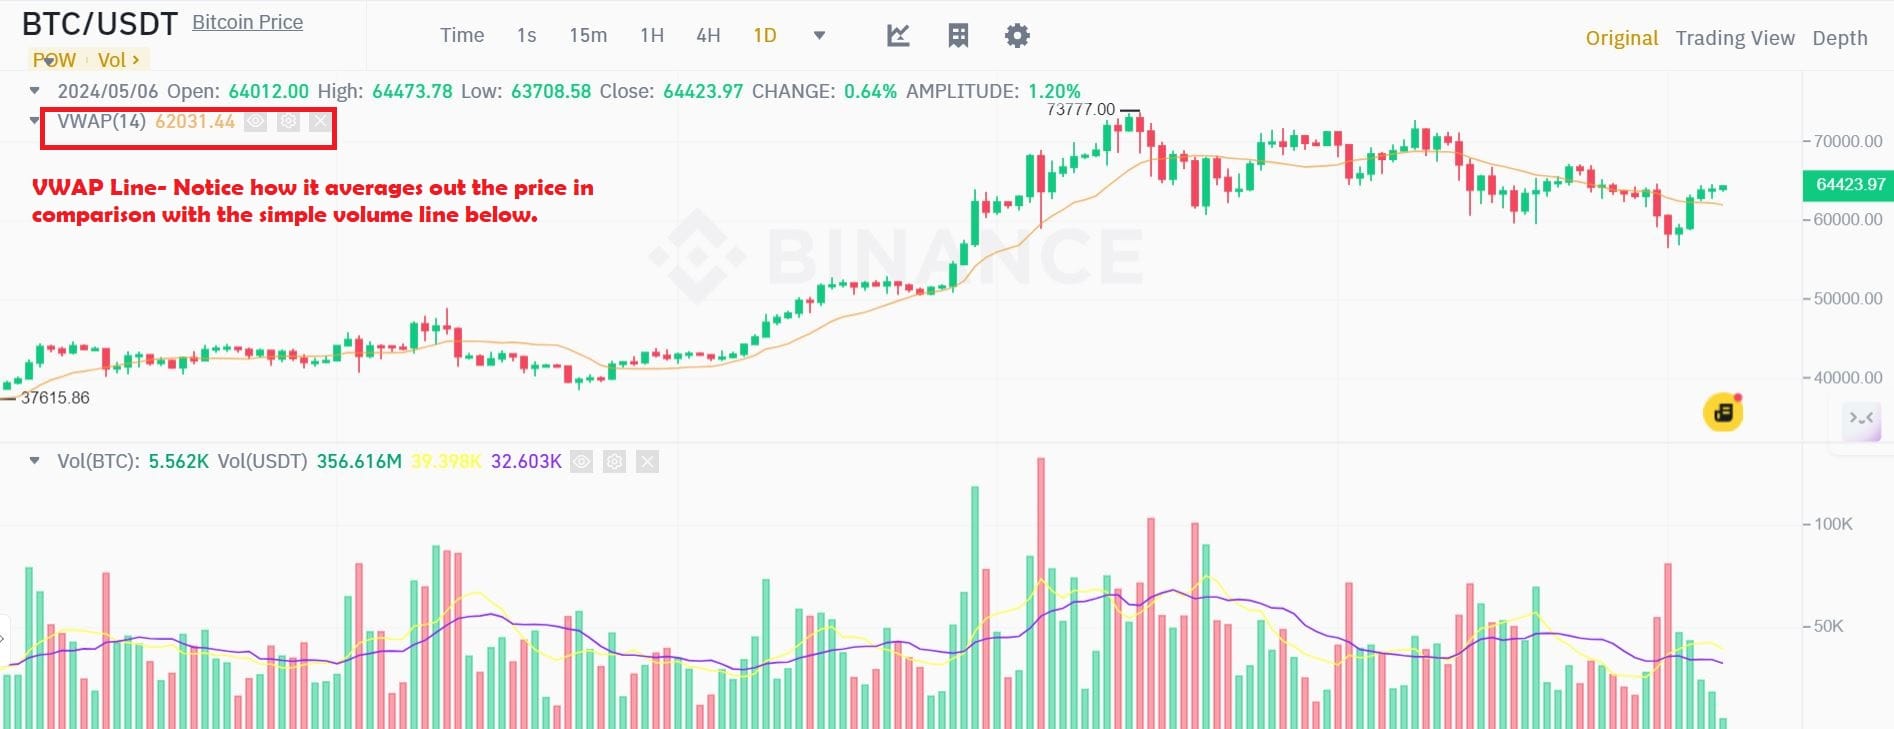
VWAP (Volume-Weighted Average Price) can be a valuable tool for supporting your trend identification, but there are more standalone methods for definitively pinpointing a trend. Here's how VWAP can be helpful:
VWAP represents the average price a security has traded throughout a specific timeframe, weighted by volume. It reflects where most trading activity has been concentrated in terms of price.
Suppose the VWAP line is consistently rising along with the price action. It suggests intense buying pressure and potential trend continuation, especially if the price trades above the VWAP line.
Conversely,
A consistently falling VWAP line alongside declining prices suggests selling pressure and a potential downtrend, especially if the price is trading below the VWAP line.
Breakouts and Retests: A clean breakout above a resistance level with rising volume and the price moving consistently above the VWAP can strengthen the confirmation of an uptrend.
Conversely, a breakout below a support level with substantial selling volume and the price moving consistently below the VWAP can strengthen the confirmation of a downtrend.
Retests of these breakout levels by the price can also be informative. The trend might hold if the price finds support at the breakout level (Uptrend) or resistance at the breakout level (downtrend) while staying near the VWAP line.
In Conclusion
Remember
These are just a few examples, and many other technical indicators are available. It's necessary to understand how each indicator works and its limitations.
Combining technical indicators and price action analysis can provide valuable insights into the market's direction and potential trend strength.
Trade Smarter!


