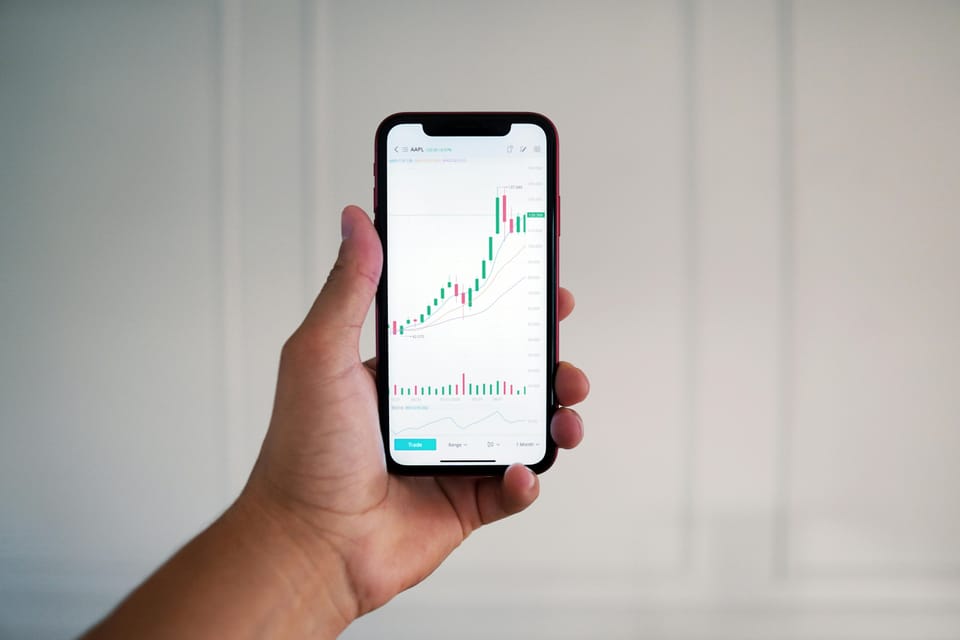
How Long Should Your Day Trading Backtest REALLY Be?
Do you know about Bernard Baruch?
Born in 1870, This American financier and statesman, amassed a fortune on the New York Stock Exchange, impressed President Woodrow Wilson by managing the nation's economic mobilization in World War and made another fortune in the postwar bull market. He also foresaw the Wall Street crash and sold out well in advance.
Quite an impressive portfolio,
isn't it?
So this wise guy once said,
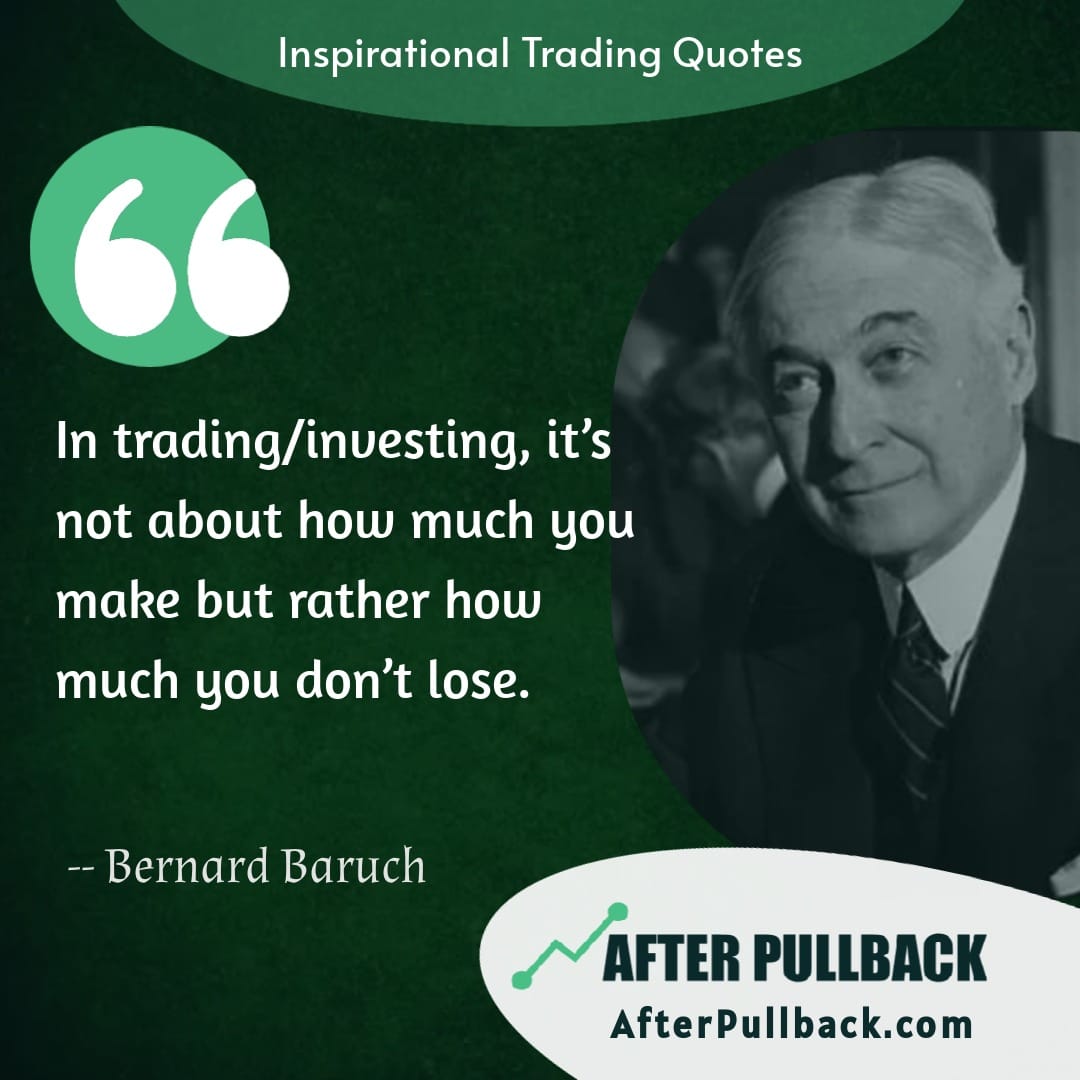
This powerful quote by Bernard Baruch captures the essence of successful day trading – preserving capital is paramount.
We all know that,
Backtesting, by simulating your strategy on historical data, helps you identify weaknesses and potential losses before risking real money.
But It also raises a crucial question:
How long should your day trading backtest be to truly assess its risk profile?
The problem is,
Finding the sweet spot can be tricky.
Backtest too briefly, and you risk overlooking critical market conditions.
Go overboard, and you might be evaluating a strategy against irrelevant historical data.
Therefore,
In this blog post, we will try to understand this problem and then will find some solutions for Day Traders.
So, buckle up and get ready to optimize your backtesting for maximum risk mitigation and, ultimately, day trading success.
The Problem of Longer Time Frame in Backtesting
Remember when the market crashed in March 2020 due to the COVID-19 pandemic?
It was chaotic!
Uncertainty was everywhere, and people were selling like crazy, causing big drops in many sectors.
Tough times, right?
Now, Imagine a day trading strategy that was tested using data from that crazy period. It might have found ways to make quick profits from all the wild price swings caused by the panic selling.
But that is the precise problem!
This strategy might not work so well in today's market.
As economies reopened and adapted to the pandemic, specific sectors (like technology and e-commerce) experienced significant growth. A strategy built solely on exploiting the panic of 2020 might miss out on these longer-term growth opportunities in the current, more selective market environment..
That's the trouble with relying on old data, especially for day traders.
Take, for instance, a technical indicator called "gap-and-fill" patterns, often used to spot potential price changes.
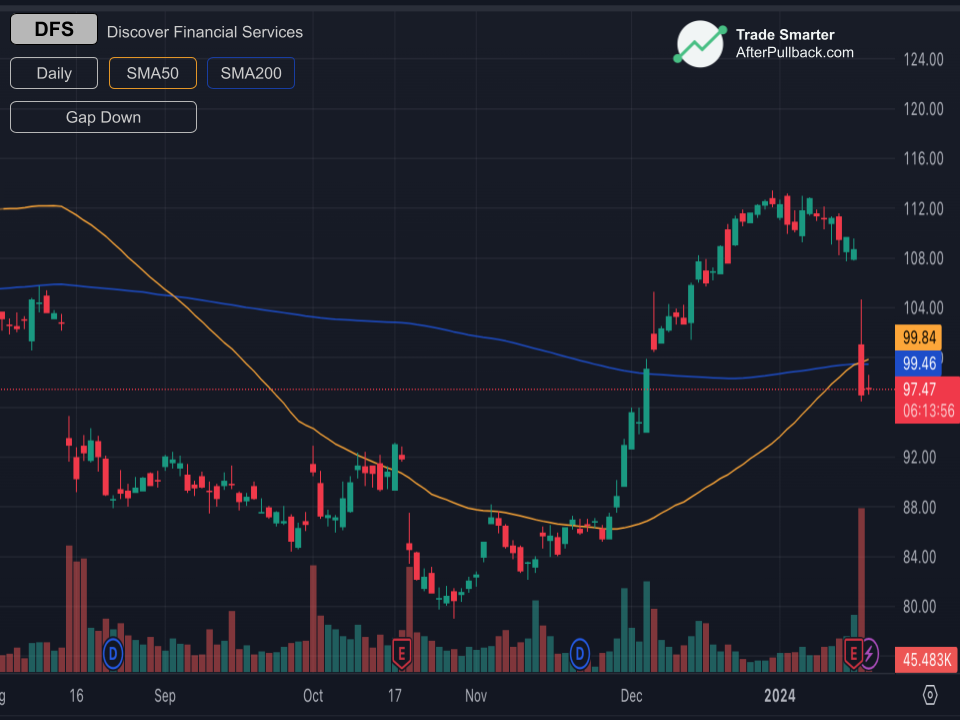
During the 2020 crash, many stocks had big gaps down as everyone rushed to sell. A strategy based on these gaps might've made money by betting that the prices would eventually bounce back up.
But here's the thing,
today's market isn't as crazy as it was during the pandemic.
Those gaps might not close up as quickly or predictably anymore. So, relying too much on this old pattern could lead to bad trades or missed opportunities.
So, what's the solution?
Maybe you're thinking, "Why not just focus on a shorter time frame, like three months?"
Well,
let's dive into that idea too.
The Issue of a Shorter Time Frame in Backtesting
Ok,
So let's say you come across an interesting idea.
Buying a specific stock whenever its price closes above its 20-day moving average, a signal that usually means the stock is on the rise.
Excited about the potential, you decide to test this strategy over the past three months, roughly 60 trading days.
Now,
There is every possibility that, at first glance, it might seem like a winner.
Your strategy consistently brings in profits, with lots of wins and impressive returns.
But wait a minute.
What if these results are just because the last three months happened to be a really good time for that stock?
Could it be a case of luck rather than a solid strategy?
See,
This is the problem with short-term testing.
It might make your strategy look great, but it could just be a coincidence that it did well during that specific period.
Short tests like this don't show how your strategy handles tough times or different market conditions.
What if there's high volatility?
How does it deal with unexpected news?
A good strategy should be able to handle all kinds of situations, but a short test won't reveal any weaknesses that might show up in real trading.
So, what should you do instead?
So, you've realized that your strategy shouldn't rely on data that's too old or too specific to a certain time.
 Imran Haider
How many years of data should you use for Backtesting?
Well,
there's no one-size-fits-all answer.
As this varies between strategy to strategy and trader to trader
But the time frame depends on an important concept
The Concept of
Statistical Significance
Statistical significance helps you figure out if your results are because of your strategy or just random luck.
You can think of It like flipping a coin and getting heads nine times out of ten.
That seems unlikely, right?
Statistical significance helps quantify that. It tells you if your strategy's success is more than just chance.
For example, let's say you tested a strategy over five years and it made a 15% return each year.
Here's where statistical significance comes in:
you calculate something called the Sharpe Ratio. If it's positive and the associated p-value is less than 0.05, it means your strategy's success is probably not just luck. It might really be better than just holding onto the stock.
I know, it sounds a bit complicated.
But the point is, there are tools out there to help you figure out if your strategy is really working or if you're just getting lucky.
So, back to the main point,
How do you make sure your testing gives you the best results?
You've probably figured out by now that finding the right balance between having enough data for reliable results and keeping it relevant to today's market is super important in backtesting.
Longer timeframes give you a broader view of how the market moves, which can help reduce the risk of making your strategy fit too perfectly to past trends.
But there's a downside: the data might get old, especially in markets that change fast. This could mess up your results.
Shorter timeframes, on the other hand, give you data that's more likely to match what's happening right now.
But there's a risk of overfitting, where your strategy fits too closely to random short-term trends.
Plus, your results might be affected by random ups and downs in the market, and your statistical tests might not be as reliable.
So, what's the answer?
Generally, For Day Trading, testing over 2-3 years is a good Starting Point.It gives you a mix of historical trends and up-to-date data.
But did you notice the word “Starting Point” above?
Its because this is NOT A HARD-AND-FAST RULE!
As you advance in your trading journey, you will notice that
For slower-changing markets (e.g., some stock indices) or strategies relying on fundamental analysis, a slightly longer timeframe (up to 5 years) might be acceptable.
On the other hand,
For highly volatile markets like cryptocurrency, a shorter timeframe (1-2 years) might be more appropriate to prioritize data relevance.
Now, Once you have the required time frame in mind,
There is one more important aspect to cover.
When you're picking a timeframe for backtesting, it's important to cover a range of market conditions.
And,
There's a way to dig even deeper
“segmentation”
This means breaking your chosen timeframe into smaller parts.
Let's say you tested a strategy over 5 years. You could split those years into smaller chunks—like yearly, quarterly, or based on specific market events, such as recessions.
By doing this, you can learn a lot:
· You can spot when your strategy does well and when it struggles. Does it make money in good times but lose it in bad ones? Segmentation shows you.
· You can see how your strategy handles changes in the market. Does it adapt well to different situations? Segmentation helps you figure that out.
· You might even find ways to tweak your strategy to make it better in certain conditions. But be careful—you don't want to mess things up by changing too much based on old data.
Importance of Recent Market Data in Day Trading
This is an important point to consider in day trading.
When you're testing your day trading strategy, it's important to focus on recent market data, especially from the past 2-3 years.
Here's why:
Markets Change Fast
Day trading is all about spotting quick opportunities in the market. But things change rapidly, like new rules or technology. Data from 10 or even 5 years ago might not show what's happening now.
Look for What's Relevant
Day trading relies on spotting patterns that lead to fast profits. But these patterns can change over time. By using recent data, you're making sure your test matches what's happening in the market right now.
It also
Avoid Sneaky Biases
Testing with old data can give you wrong ideas because you might accidentally use what you know now about the future to make your strategy seem better than it really is. Using recent data helps avoid this.
But don't forget,
it's also good to look at older data sometimes. Here's how to balance it out:
Use a mix of recent data and slightly older data, like from 5-7 years ago, to get a good overall picture of how your strategy works.
Focus on how adaptable your strategy is.
You want something that can handle whatever the market throws at it. Segmenting your recent data can help you see how well your strategy adapts.
In conclusion
Backtesting is a crucial tool for day traders, offering valuable insights into the effectiveness of their strategies. By carefully selecting the timeframe for backtesting, traders can strike a balance between capturing historical trends and ensuring data relevance to current market conditions.
Prioritizing recent market data, typically from the past 2-3 years, helps mitigate the risks of relying on outdated information and reduces the likelihood of introducing biases into the testing process. However, it's essential to supplement recent data with slightly older data to gain a comprehensive understanding of strategy performance across diverse market conditions.
Additionally, segmentation of the chosen timeframe allows for a deeper analysis of strategy adaptability and performance under different market regimes. Ultimately, while backtesting serves as a guide for day traders, it's important to remember that success in trading depends on a combination of strategy, adaptability, and real-time decision-making in the dynamic landscape of financial markets.
Trade Smarter!


