How do you use a moving average to buy stock?

Consider you are checking out a stock you've been interested in, but you're wondering if now's the right time to buy.
One way to get a clearer picture is to look at how the stock's price has performed over a recent period.
You might be tempted to jump in if it's been steadily climbing, but worry it could be peaking.
On the other hand, if it's been dipping, you might hesitate, wondering if it'll keep dropping.
Here's where a moving average comes in handy.
It smooths out the stock's price history, giving you a better sense of its overall trend.
So,
Instead of staring at a jumble of daily price jumps and dips, you can focus on the moving average line. If that line is sloping upward, the stock is generally trending up. If it's sloping downward, it points to a downward trend.
In the blog post below, we will understand moving averages and their types, try to analyze how they fit into your trading strategy, and help us buy stocks.
What is a moving average?
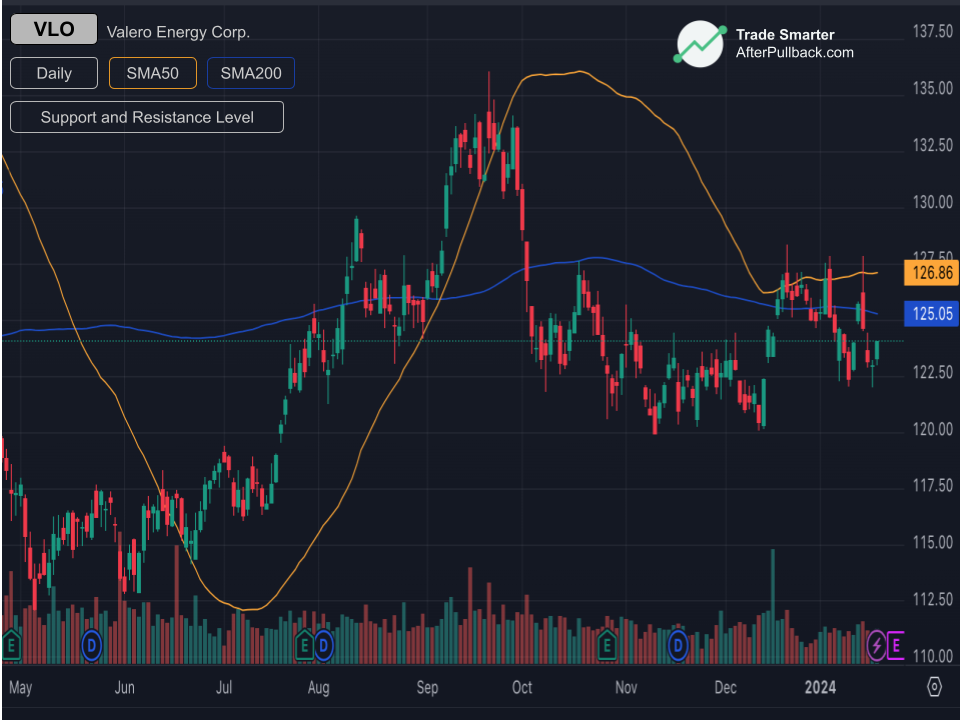
A moving average is a technical indicator used in stock and financial analysis to smooth out price data and identify potential trends. It is calculated by taking the average of a security's price over a specific period, such as ten days, 50 days, or 200 days. As the price data moves forward, the average is constantly recalculated, dropping the oldest data point and adding the latest one. This creates a line on the stock chart that reflects the average price trend over the chosen period. (See below the yellow line is 50days simple moving average line and the blue one is 200 days simple moving average line.
Purpose of moving averages
The primary purpose of moving averages is to
Identify trends
A rising moving average indicates an uptrend, while a falling average suggests a downtrend. This helps you understand the overall direction of the stock price.
They also,
Spot support and resistance levels
When the price touches or bounces off the moving average line, it can act as a support or resistance level, respectively. This can help identify potential entry and exit points for trades.
They are also quite helpful to
Reduce noise
Moving averages filter out short-term price fluctuations, making it easier to see the bigger picture and avoid catching up in daily market volatility.
Moving averages are a relatively straightforward technical indicator, even for beginner investors.
You can use different moving average lengths to analyze short-term and long-term trends.
Types of Moving Averages
There are several types of moving averages, each with advantages and disadvantages. The most common types are:
1. Simple Moving Average (SMA):
The SMA is the most basic type of moving average. It is calculated by adding the closing prices of the last N periods and dividing by N. For example, a 5-day SMA would be calculated by adding up the closing prices of the last 5 days and dividing by 5.
The Biggest Advantage of SMA is that it is easy to calculate and understand.
However, SMAs Can be laggy, meaning it can take time to react to changes in price. Also, they are less responsive to recent price changes than other moving averages.
2. Exponential Moving Average (EMA):
The EMA is a weighted moving average that gives more weight to recent price data than older data. This is done by applying a weight (typically between 0.2 and 0.5) to the most recent closing price and multiplying the remaining weight by the previous EMA. This process is repeated until the first EMA is reached.
This process makes EMA more responsive to recent price changes than SMAs.
But at the same time, this makes them more complex to calculate than SMAs. Another drawback is that it can be more sensitive to short-term fluctuations.
3. Weighted Moving Average (WMA):
The WMA is another type of weighted moving average, but it assigns weights to different data points within the window. The most common type of WMA is the linear WMA, which assigns a weight of 1 to the most recent price, 2 to the second most recent price, and so on until the weight reaches N at the oldest price.
By giving more weight to recent data, WMAs can react more quickly to changes in the underlying data series. This makes them more sensitive to emerging trends and patterns than simple moving averages (SMAs) that treat all data points equally.
WMAs can help reduce the impact of short-term volatility or noise in the data. They effectively smooth out temporary fluctuations and highlight longer-term trends by assigning lower weights to older data.
Using Moving Averages for Buy Signals:
Moving averages generate buy signals through various patterns and interactions with the stock price. Here are some of the most common methods;
1. Crossovers:
When a shorter-term moving average crosses a longer-term one, it suggests a potential trend reversal. These trend reversals present possible trading opportunities.
Golden Cross:
It Occurs when a shorter-term moving average (e.g., 50-day) crosses above a longer-term moving average (e.g., 200-day) from below.
Traditionally, this has been seen as a bullish signal, suggesting an upward trend in price may be developing.
The shorter-term moving average crossing above indicates upward momentum, potentially overcoming the longer-term resistance represented by the 200-day average.
Death Cross:
It Occurs when a shorter-term moving average (e.g., 50-day) crosses below a longer-term moving average (e.g., 200-day) from above.
Traditionally, this has been seen as a bearish signal, suggesting that a downward price trend may develop.
The shorter-term moving average crossing below indicates weakening upward momentum, potentially succumbing to the longer-term downward pressure represented by the 200-day average.
2. Price Bounces and Moving Averages
Price bounces are a common technical analysis concept where the price of an asset reverses direction after touching or coming close to a moving average.
When the price bounces off a moving average, it suggests support or resistance at that level. This means there is buying or selling pressure at that price point, which can either push the price back up (support) or down (resistance).
Here's a breakdown of the different scenarios:
Bouncing off a long-term moving average in an uptrend:
In an uptrend, a long-term moving average, such as the 200-day MA, often acts as a support level. This means that if the price dips down and touches the 200-day MA, there is usually enough buying pressure to push the price back up.
A bounce off the 200-day MA in an uptrend can be seen as a buy signal, suggesting that the uptrend is likely to continue. Traders might wait for confirmation from other indicators before entering a long position, but a bounce off the 200-day MA is often seen as a positive sign.
Bouncing off a short-term moving average in a downtrend:
A short-term moving average, such as the 50-day MA, can act as a resistance level in a downtrend. This means that if the price rallies up and touches the 50-day MA, there is usually enough selling pressure to push the price back down.
A bounce off the 50-day MA in a downtrend can be seen as a sell signal, suggesting that the downtrend is likely to continue. Traders might wait for confirmation from other indicators before entering a short position, but a bounce off the 50-day MA is often seen as a negative sign.
3. Using Moving Averages for Risk Management
Moving averages can help manage risk by identifying potential support and resistance levels:
Support: A stock price is more likely to find support at a moving average, especially a long-term one. If the price falls and touches the moving average but bounces back, it may signal a good entry point.
Resistance: Conversely, a stock price might encounter resistance at a moving average, especially a short-term one. If the price rises and touches the moving average but gets rejected, it could be a warning sign for short-term traders.
Using Moving Averages in combination with other indicators:
Combining moving averages with other technical indicators can strengthen your signal analysis.
Moving averages primarily identify trends and support/resistance levels. Other indicators, like oscillators or volume analysis, measure momentum, overbought/oversold conditions, or buying/selling pressure.
Combining them provides cross-confirmation. If the moving average and the other indicator point in the same direction, the signal strengthens and increases confidence in your analysis.
Here are some combinations that can be applied
1. Golden Cross with MACD:
The Golden Cross, formed by a short-term SMA crossing above the 200-day SMA, is a classic bullish indicator that suggests a shift in momentum towards a bullish trend.
However, to confirm this trend, refer to the Moving Average Convergence Divergence (MACD).
The MACD measures the difference between two moving averages of different lengths, indicating momentum and trend changes.
When the MACD line crosses above its signal line, it confirms this bullish momentum, strengthening the buy signal.
When the buy signals from both indicators are aligned, it can increase the strength of these signals.
2. Moving Average Bounce with Stochastic Oscillator
The 20-day SMA acts as a dynamic support level in an uptrend.
On the other hand, the Stochastic Oscillator measures momentum within a specific price range, with readings below 20 often considered oversold.
A price bounce off the 20-day SMA suggests buying pressure is emerging.
If the Stochastic Oscillator simultaneously crosses above its %K and %D lines, it confirms the bullish momentum, enhancing the buy signal.
3. Moving Average Channel Breakout with Bollinger Bands:
The 50-day SMA acts as a trend indicator.
Bollinger Bands measure volatility, with wider bands suggesting increased price swings.
A price breakout above the upper Bollinger Band signals potential trend acceleration.
If the price remains above the 50-day SMA after the breakout, it validates the bullish momentum, strengthening the buy signal.
4. Moving Average Support with Volume Confirmation:
The 200-day SMA often acts as a significant support level in long-term trends.
Volume, on the other hand, measures the intensity of buying and selling activity.
If the price finds support at the 200-day SMA, it suggests buying pressure is defending the level.
A significant increase in volume during this support test confirms the buying interest, reinforcing the buy signal.
Remember: Limitations and Cautions
Moving averages are powerful tools for technical analysis, but they're flexible. Here are some limitations to keep in mind, along with potential ways to overcome them:
1. Lagging Indicator:
Moving averages, by nature, react after the price has moved. They smooth out data, making them prone to lagging behind significant price changes.
The Solution is to Combine moving averages with leading indicators like oscillators or volume analysis to identify potential turning points earlier.
You can also use shorter-term moving averages for faster responsiveness, but be aware of increased noise.
2. Difficulty in Volatile Markets:
Moving averages can whipsaw back and forth in highly volatile markets, generating confusing signals.
Although you can consider longer-term moving averages for stability, you might miss out on short-term opportunities.
Combining volatility indicators like Average True Range (ATR) to gauge market fluctuations and adjusting your analysis may work well for you.
3. Oversimplification:
Moving averages offer a single, averaged trend line, which can mask underlying price dynamics.
One of the Solutions can be to use multiple moving averages with different timeframes to create a "band" and understand the trend's strength and potential support/resistance levels.
You can also analyze candlestick patterns and other technical indicators alongside moving averages for a more comprehensive picture.
Conclusion:
Remember, moving averages are valuable tools, but they're just one piece of the puzzle. By understanding their limitations and combining them with other devices and strategies, you can gain a more nuanced perspective on the market and make informed trading decisions.
Frequently Asked Questions(FAQs):
1. Which moving average should I use?
The "best" moving average depends on your trading style and goals. Shorter-term MAs like the 10-day or 20-day are quicker to react to changes but also generate more noise. Longer-term MAs like the 50-day or 200-day are smoother and better for identifying long-term trends, but they might miss out on short-term opportunities. Experiment and find what works best for you!
2. Can moving averages predict the future?
Nope! Moving Averages are based on past data and can't guarantee future price movements. While they can help identify potential buy signals, always remember that the market is unpredictable and unexpected events can occur.
3. What happens when MAs cross each other?
Crossovers between different moving averages can signal potential trend changes. A common one is the Golden Cross, where the shorter-term MA crosses above the longer-term MA, suggesting a potential shift from downtrend to uptrend. Remember, crossovers alone aren't definitive signals, so confirm them with other indicators and chart patterns.
4. Do moving averages work in all markets?
While moving averages can be helpful in many markets, they might not perform as well in highly volatile or sideways markets. In such cases, it's even more important to combine them with other tools and be extra cautious when making trading decisions.
5. Can I make a living just using moving averages?
While some skilled traders manage to profit just based on moving averages, it's generally not recommended for beginners or as a standalone strategy. Remember, the market is complex and requires a comprehensive approach that considers various factors. Use moving averages as part of a broader trading strategy that includes risk management and fundamental analysis.
6. Can moving averages help me set stop-loss orders?
Moving averages can act as dynamic support and resistance levels, offering potential stop-loss placement options. Consider placing your stop-loss just below a key moving average in an uptrend or just above it in a downtrend. Remember, always adjust your stop-loss based on market conditions and risk tolerance.
7. What about moving averages for other assets besides stocks?
Moving averages can be applied to analyze price trends in various assets, including forex, commodities, and even cryptocurrencies. The underlying principles remain the same, although specific interpretations and trading strategies might need adjustments based on the specific asset class.
8. Are there any alternatives to moving averages for identifying trends?
While moving averages are popular, alternative technical indicators like trendlines, MACD, or Bollinger Bands can also help identify trends. Consider exploring different tools and find what fits your learning style and preferred analysis methods.
9. Is using moving averages a guarantee for success in trading?
Unfortunately, no single indicator guarantees success in the market. Moving averages are a valuable tool, but they should be used as part of a comprehensive trading strategy, along with risk management, fundamental analysis, and a realistic understanding of market dynamics.


