Five High-Impact Trading Setups with Price Action Scanners

Do you remember your early days in day trading?
Although you must have an understanding of some basic tools but the learning curve must have been steeper than anticipated. Countless missed opportunities, confusing charts, and the constant fear of missing out (FOMO) must have gone through your mind as well.
This experience is all too common for traders. The sheer volume of information and ever-changing market conditions can be overwhelming. Deciding when to enter and exit trades becomes a constant battle against emotions and a lack of clear strategies.
So,
In the blog post below, we have compiled five high-impact day and swing trading strategies that go beyond the basics. By leveraging powerful price action setups and the efficiency of scanners, you'll gain the confidence to identify profitable opportunities in any market condition.
So, without further delay, let's dive straight into these strategies.
Strategy 1: Breakouts from Trendlines/Channels with Price Action
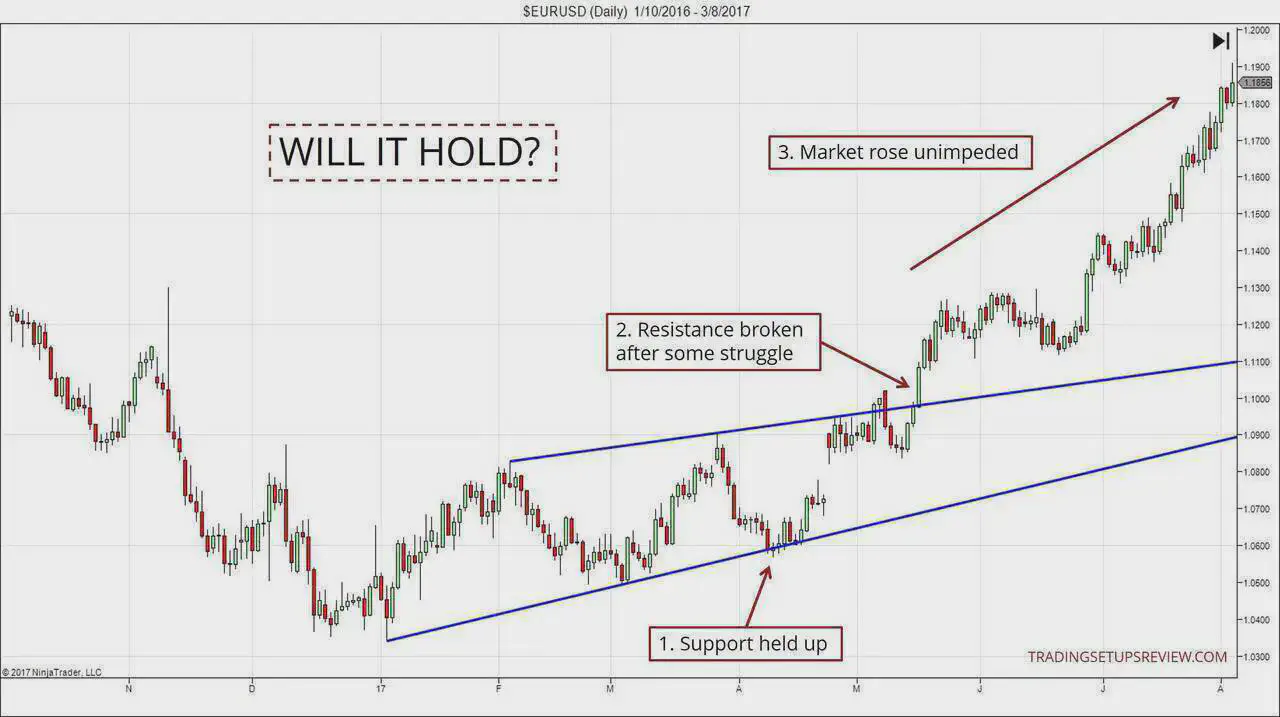
In technical analysis, a breakout from a trendline/channel happens when the price of an asset decisively breaks through the established boundaries of a trendline or channel. Imagine a trendline as a slanted line connecting highs (uptrend) or lows (downtrend), and a channel as two trendlines creating a zone the price moves in.
Breakouts present trading opportunities because they potentially signal a shift in the price direction:
- Upward Breakout: Price decisively closes above a resistance trendline (uptrend) or the upper trendline of an uptrend channel. This suggests a potential continuation or acceleration of the uptrend, offering a chance to buy low and sell higher.
- Downward Breakout: Price decisively closes below a support trendline (downtrend) or the lower trendline of a downtrend channel. This suggests a potential continuation or acceleration of the downtrend, offering a chance to sell high and buy back lower (short selling).
Here's the key takeaway: Breakouts can signal a trend change, allowing you to potentially enter trades that benefit from the new direction. But remember, confirmation and proper risk management are crucial before acting on a breakout.
Here is how you can setup your scanner to take advantage of these breakouts
- Timeframe: Set it to a short-term timeframe like 15-minute or 30-minute charts.
- Price: Look for instruments with established trendlines or channels on the chart. A trendline connects at least two prior highs/lows for an uptrend or downtrend channel, respectively. The longer the trendline/channel holds, the stronger the potential breakout.
- Volume: Include a filter for above-average volume on the breakout day. This indicates increased buying or selling pressure behind the price move, potentially signaling a stronger breakout. You can define "above-average" based on the instrument's typical daily volume or the recent trading range within the channel.
Do you know Why setting these criteria Helps?
Identifying Potential Moves: The scanner highlights instruments experiencing significant price movements that might be breaking established trendlines or channel boundaries.
Focusing on Stronger Breakouts: The volume filter helps you focus on breakouts with more conviction, where there's a surge in buying or selling activity.
 Imran Haider
Don’t Forget the Risk Management
Stop-Loss Placement: This is crucial. Place a stop-loss just below the broken support level (long trades) or above the broken resistance level (short trades). This limits your potential losses if the breakout fails and the price reverses back into the channel.
Position Sizing: Even with a scanner helping you identify breakouts, proper position sizing is vital. Remember, breakouts can be false, so allocate a small percentage of your capital per trade.
There are some Additional Considerations as well
Trend Confirmation (not a scanner filter): While not a direct filter, consider if the breakout coincides with the overall trend. Look for breakouts above resistance in an uptrend or below support in a downtrend for higher probability trades.
False Breakouts: Be aware that breakouts can be deceptive. Look for additional confirmation beyond just the price crossing the trendline/channel. This could involve:
· Price Action Patterns: Candlestick patterns like engulfing bars or failed breakout patterns on smaller timeframes can indicate a potential reversal.
· Indicators: Moving average crossovers or momentum indicators can provide clues about the strength of the breakout.
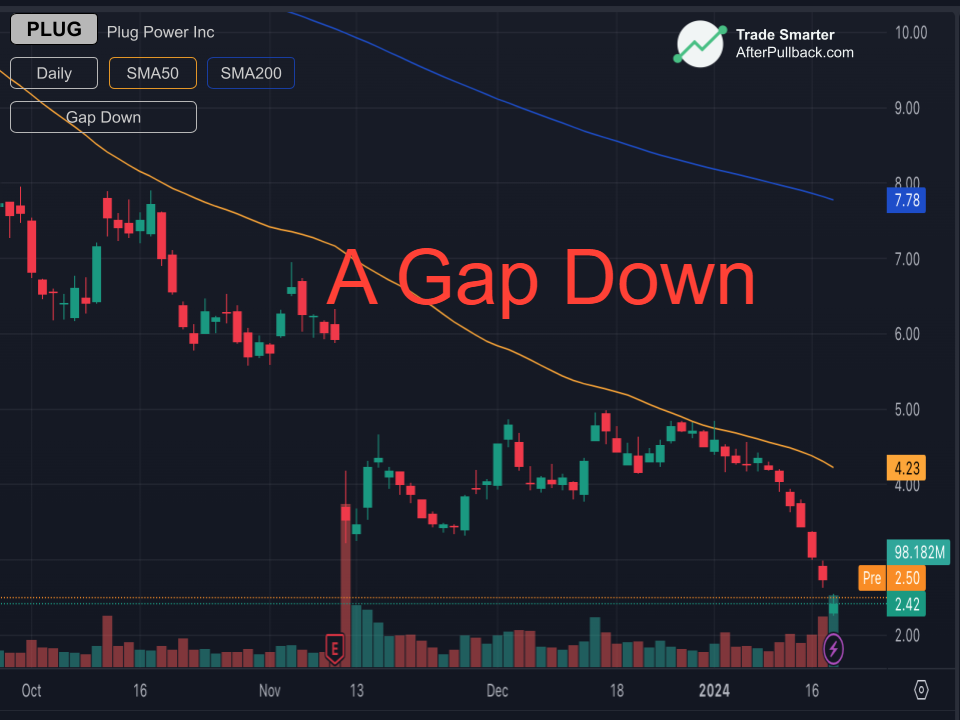
Strategy 2: Gap Up/Down Entries with Price Action Scanners
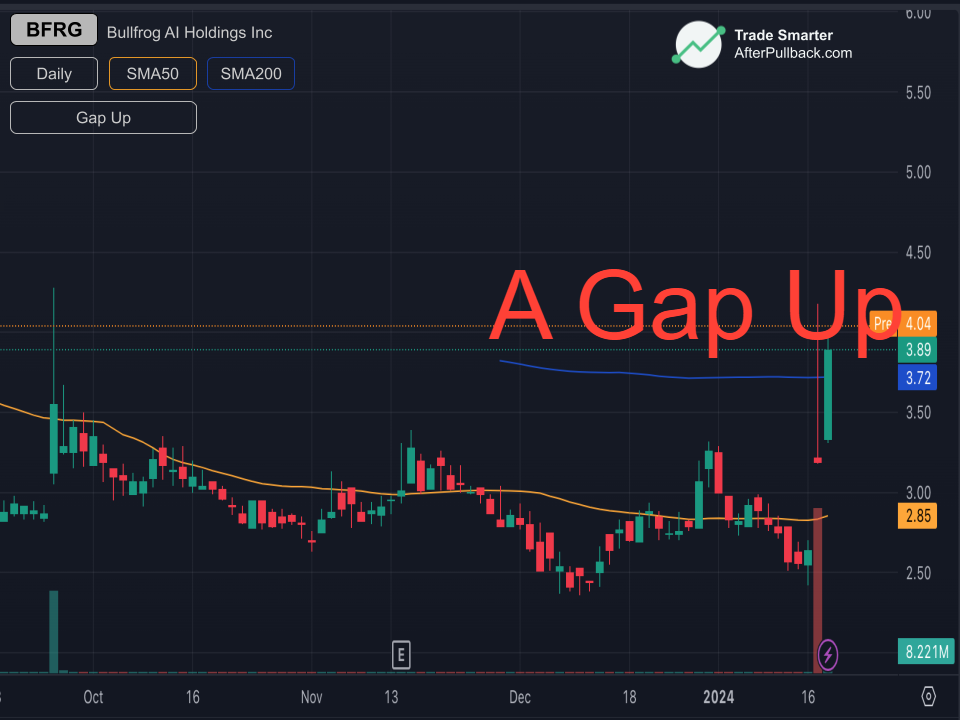
These entries occur when the price of an asset opens significantly higher (Gap Up) or lower (Gap Down) compared to the previous day's closing price. This creates a "gap" on the price chart, where there were no trades at specific price points.
Gaps can provide interesting Trading Opportunities, entry points for trades,
Gap Ups suggests potentially strong buying pressure, which might lead to a continuation of the uptrend. A trader could enter a long position (buying) expecting the price to keep rising.
On the other hand,
Gap Down suggest potentially strong selling pressure, which might lead to a continuation of the downtrend. A trader could enter a short position (borrowing and selling the asset) expecting the price to keep falling (with the intention to buy back later at a lower price to return the borrowed asset).
Gap up/down entries can be volatile and require a cautious approach. Here's how you can set up your scanner for them
- Price: This is the core filter. Look for instruments that gap up (open significantly higher than the previous day's close) or gap down (open significantly lower). You can define "significantly" as a percentage difference from the previous close (e.g., +/- 2%).
- Volume: Consider these filter options:
- Higher Open Volume: Look for a surge in volume on the open compared to the previous day's average volume. This suggests strong buying or selling pressure behind the gap.
- Sustained Volume: If the gap persists throughout the day, filter for instruments that maintain above-average volume compared to their recent trading range. This indicates ongoing buying/selling interest.
The volume filter helps you focus on gaps with potentially more conviction, where there's a substantial increase in buying or selling activity at the open.
Again, the Risk Management needs to be on top.
Stop-Loss Placement: Gaps inherently create wider entry points, so be prepared for larger potential losses. Tight stop-loss orders become even more crucial.
· For Gaps Up: Place your stop-loss just below the opening price on a gap up entry. This exits you if the price quickly reverses lower.
· For Gaps Down: Consider a stop-loss slightly above the opening price for gaps down, especially if there are signs of buying pressure emerging.
Position Sizing: Be very conservative with position sizing for gap entries. The increased volatility can lead to unexpected price swings.
There are certain additional Considerations
Large gaps can be riskier due to the increased volatility. You might choose to filter for smaller gaps that are more likely to hold.
Similarly,
You can also check for major news announcements or earnings reports that might explain the gap. Sudden gaps without clear catalysts can be more prone to reversal.
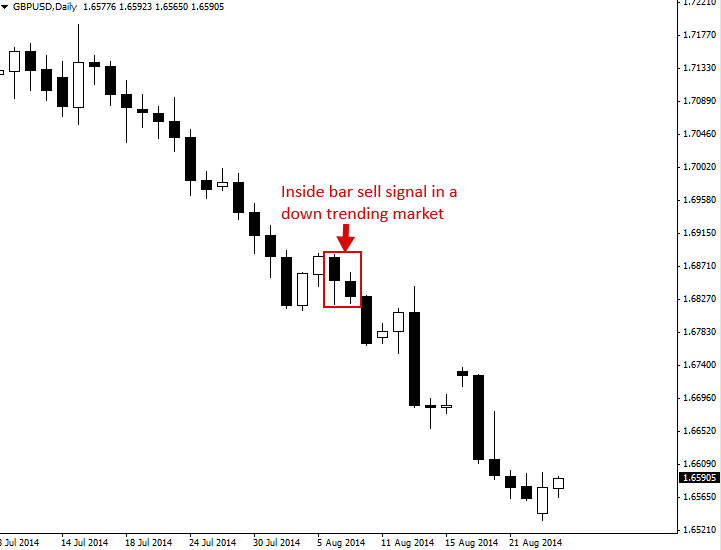
Strategy 3: Inside Bar Setups with Price Action Scanners
An inside bar pattern on a price chart consists of two bars. The second bar (inside bar) is entirely contained within the price range (high and low) of the first bar (mother bar). This suggests a period of consolidation or indecision in the market following a strong price movement in the direction of the mother bar.
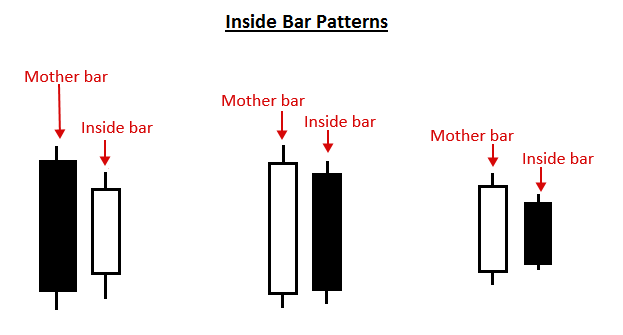
Inside bars can be a good starting point for identifying potential trading opportunities like breakouts in day trading. This is due to the consolidation phase they represent.
Breakout Entry: The breakout occurs when the price decisively moves above the high of the mother bar (for an uptrend) or below the low of the mother bar (for a downtrend). This suggests a potential continuation of the prior trend after the consolidation.
· Long Entry: A trader might enter a long position (buying) on a breakout above the high of the mother bar in an uptrend, expecting the price to continue rising.
· Short Entry: A trader might enter a short position (selling borrowed shares) on a breakout below the low of the mother bar in a downtrend, expecting the price to keep falling (with the intention to buy back later at a lower price to return the borrowed shares).
Now,
Here's a breakdown of how day traders can leverage price action scanners to identify inside bar setups and manage risk:
Here is how to Setup your scanner
- Timeframe: You can set it to a short-term timeframe like 15-minute or 30-minute charts, ideal for capturing quick moves associated with inside bar breakouts.
- Price: Look for instruments that have formed an inside bar pattern on the current timeframe. An inside bar occurs when the entire price range of a bar (including the high and low) is contained within the prior bar's range.
This scanner setup will highlight instruments experiencing a potential pause in price movement (inside bar), which could be followed by a breakout in either direction.
There are some Additional Considerations as well which you can apply (not directly filterable):
Ideally, the inside bar forms within an established uptrend or downtrend. This provides context for the potential breakout direction:
For Upward Trend, Look for breakouts above the high of the prior bar (bullish breakout). For Downtrend, Look for breakouts below the low of the prior bar (bearish breakout).
Similarly,
While not a scanner filter, consider waiting for additional confirmation beyond just the price breaking the prior bar's range.
For this, you may look for bullish engulfing bars (for long trades) or bearish engulfing bars (for short trades) on the breakout bar. These patterns suggest a potential reversal of the prior consolidation phase.
Here is another point to consider,
While not always available as a direct filter for breakout bars, you can also consider including a filter for slightly above-average volume on the breakout day. This can indicate increased buying/selling pressure behind the breakout, potentially signaling a stronger move.
Stop-Loss Placement: This is crucial for managing risk in these short-term trades.
- Long Trades: Place a stop-loss just below the low of the inside bar.
- Short Trades: Place a stop-loss just above the high of the inside bar.
Position Sizing: Maintain a conservative position size for inside bar breakouts, as these are relatively short-term trading opportunities.
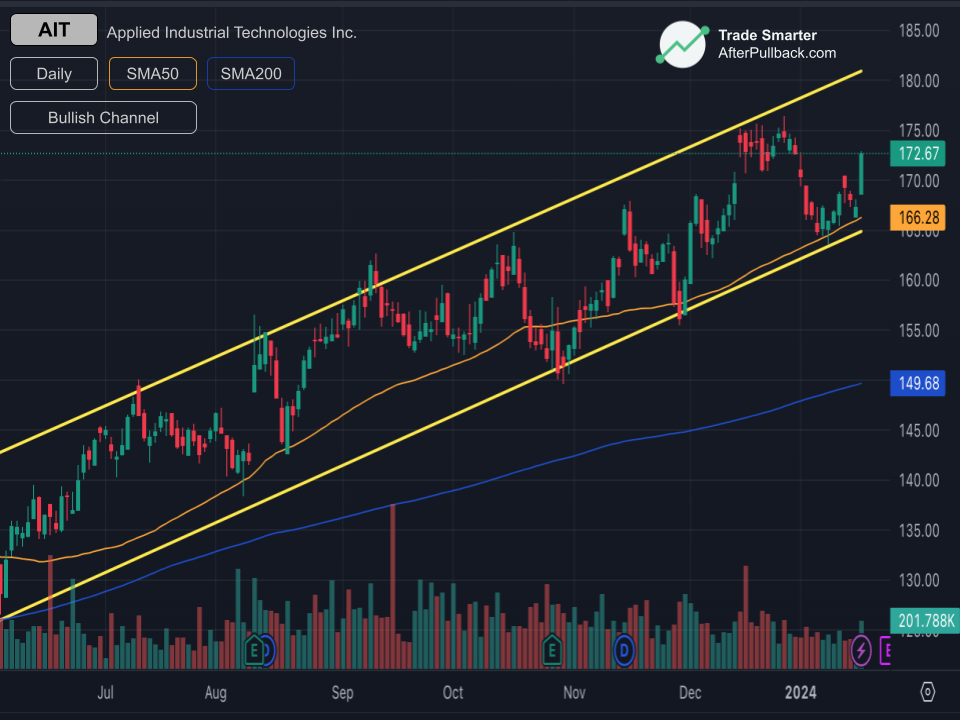
Strategy 4: Swing Trading: Pullbacks to Support with Price Action Scanners
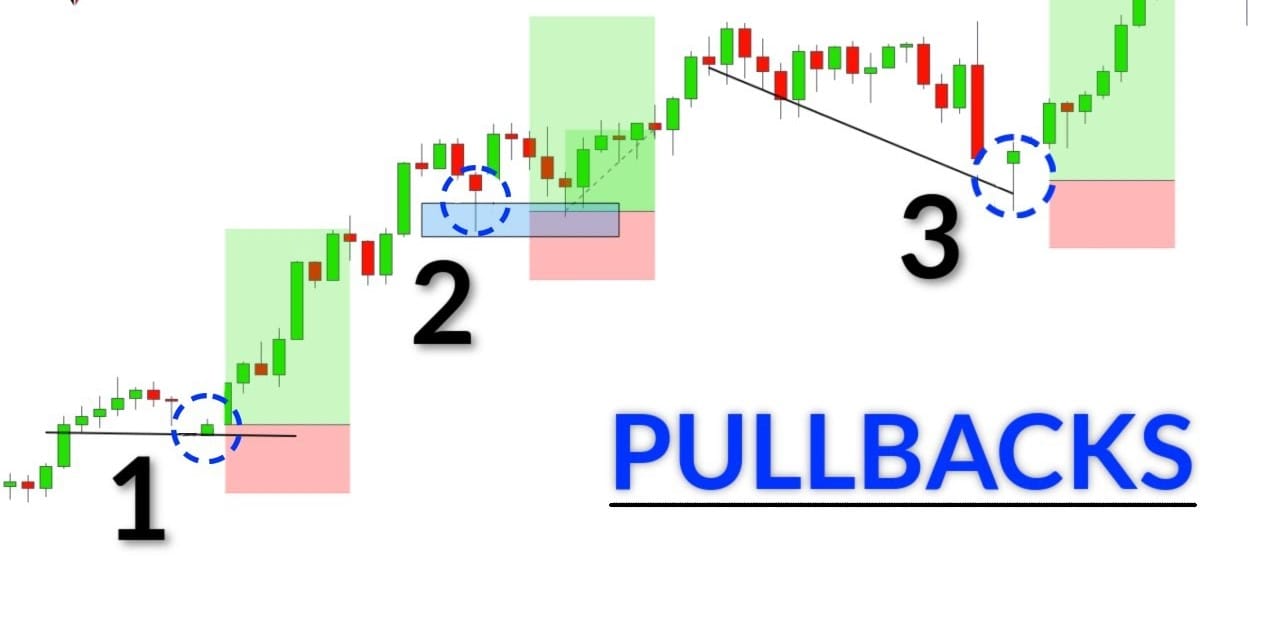
In swing trading, a pullback refers to a temporary decline in price following a preceding uptrend. A support level is an area on the price chart where the price has historically found buying pressure, preventing it from falling further. This creates a zone where the price might bounce back up.
This offers some valuable Swing Trading Opportunities
Buying Opportunities at a Discount: The pullback represents a temporary dip in an otherwise rising price, allowing you to enter a long position (buying) at a potentially lower price point compared to the recent highs.
Trend Confirmation: The presence of a support level suggests prior buying interest at that price point. If the price finds support again during a pullback, it reinforces the underlying uptrend.
Here's how to set up your scanner
- Trend: Look for instruments in an established uptrend. You can achieve this by filtering for instruments above their moving average (e.g., 50-day or 200-day) or by visually identifying a series of higher highs and higher lows on the chart.
- Price: Look for pullbacks towards a previously defined support level. This could be a moving average, a prior swing low, or a horizontal support zone identified on the chart.
By this setup, you may find instruments experiencing pullbacks within an uptrend, potentially offering entry points for swing trades.
You can also consider including a filter for increased volume at the support level. This suggests buying pressure emerging as the price approaches support, potentially indicating a buying opportunity for a swing trade.
Here are some Additional Considerations (not directly filterable)
Pay attention to the Strength of the Pullback
Shallow pullbacks might not offer enough risk-reward potential for swing trading. Look for pullbacks that retrace a decent portion of the recent uptrend but don't completely erase it.
Also,
Look for Price Action at Support
Look for signs of bullish reversal at the support level. This could involve candlestick patterns like bullish engulfing bars or hammers, indicating buying pressure and a potential bounce.
For Stop-Loss Placement, You can place a stop-loss just below the support level. This limits your potential loss if the support breaks and the uptrend fails.
Also,
Since swing trades are held for longer periods, position sizing becomes even more critical. You need to allocate a smaller percentage of your capital per swing trade compared to day trades, considering the potential for extended price fluctuations.
While scanners help identify pullbacks, consider using additional swing trading indicators like relative strength index (RSI) or stochastic oscillator to gauge potential overbought/oversold conditions at the support level, further strengthening your entry signals.
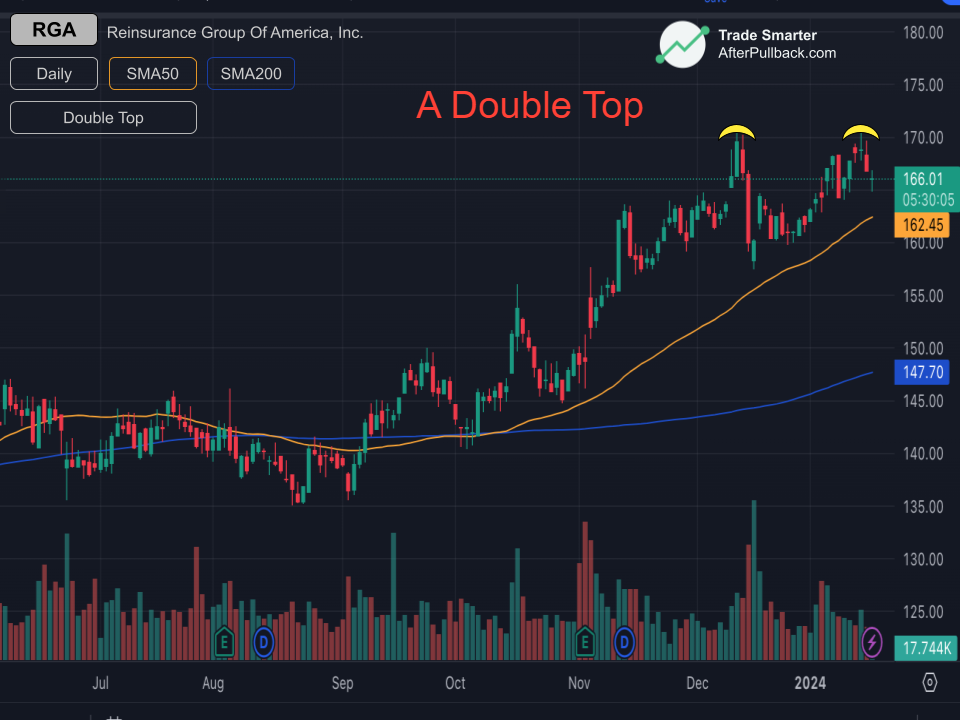
Strategy 5: Swing Trading: Double Tops/Bottoms with Price Action Scanners
Double tops and bottoms are common reversal patterns in technical analysis used by swing traders. They can signal a potential shift in the prevailing trend.
- Double Top: This pattern resembles an "M" on the chart and indicates a possible trend reversal from uptrend to downtrend. It forms when the price reaches a peak, pulls back slightly, then reaches a second peak around the same level as the first, before falling decisively.
- Double Bottom: This pattern resembles a "W" on the chart and indicates a possible trend reversal from downtrend to uptrend. It forms when the price reaches a low, pulls back slightly, then reaches a second low around the same level as the first, before rising decisively.
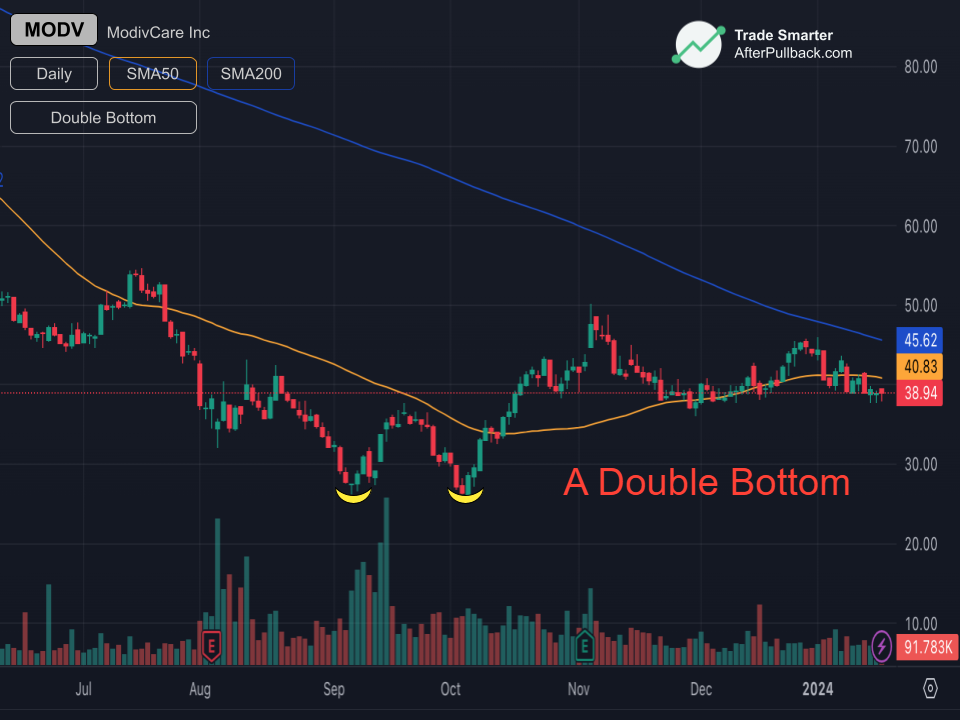
Swing Trading Opportunities with Double Tops/Bottoms:
These patterns offer swing trading opportunities because they suggest a potential change in price direction:
Shorting on Double Tops: A trader might enter a short position (borrowing and selling the asset) near the neckline (horizontal line connecting the lows of the two troughs) of a double top, expecting the price to continue falling after the break below the neckline.
Going Long on Double Bottoms: A trader might enter a long position (buying) near the neckline of a double bottom, expecting the price to continue rising after the break above the neckline.
Here's how you can setup your scanner to identify double top/bottom patterns
Price: Look for instruments forming double top (potential trend reversal from uptrend) or double bottom (potential trend reversal from downtrend) patterns.
Another important point to note is,
While directly filtering for complex chart patterns might not be possible on all scanners, some offer filters for specific candlestick patterns like bearish engulfing bars (potential signal within a double top) or bullish engulfing bars (potential signal within a double bottom).
Here are some important additional Considerations as well which may not be directly filterable):
Look for well-defined double top/bottom patterns with the following characteristics:
· Price Action: Two relatively equal highs/lows for double tops/bottoms.
· Neckline: A horizontal line connecting the lows of the two troughs (double bottom) or the highs of the two peaks (double top).
· Volume: Ideally, the second top/bottom should form on lower volume compared to the first top/bottom, suggesting weakening momentum in the prevailing trend.
You can also set some more Scanner Filters as an Alternative - if pattern filters not available
Look for instruments with these characteristics:
· Price & Volume: Two consecutive price peaks (double top) or troughs (double bottom) accompanied by a decrease in volume on the second peak/trough.
· Trend: For double tops, scan for instruments in an established uptrend. For double bottoms, scan for instruments in a downtrend.
Why This is an Alternative?
This filters for price action characteristics associated with double top/bottom formations, though it won't guarantee a perfect pattern.
Stop-Loss Placement:
For Double Tops, Place a stop-loss just below the neckline. For Double Bottoms, Place a stop-loss just below the swing low of the second bottom.
Position Sizing: Double tops/bottoms are reversal patterns, so the success of your trade relies on the price breaking the established trend. Maintain a conservative position size to account for the potential for the trend to continue if the breakout fails.
Here are some additional Tips!
Always go for Breakout Confirmation
Don't enter the trade solely based on the formation of the double top/bottom pattern. Wait for a confirmed breakout above the neckline (double bottom) or below the neckline (double top) before entering. This breakout can be accompanied by increased volume to signal a stronger trend reversal.
Similarly,
Double top/bottom patterns can have a measured move target. The measured move is the distance between the neckline and the top/bottom of the pattern, projected from the breakout point. This provides a potential profit target based on the historical price movement.
Trade Smarter!!


