Five High-Impact Day Trading Strategies with Price Action Scanners

Do you want to enter into a trade and get out of it in a single day with profit in your pocket?
Isn't it an ideal scenario for every trader?
The idea of taking profit every day is no doubt fascinating, but it’s a difficult one to execute, especially when you don’t have any proper tools in hand!
The reason?
Well, there can be many reasons for this but one of the most fundamental obstacles is the timely identification of opportunities in the market, executing them on time and then exiting the trade on time.
And this is precisely what the profitable Day Traders do.
How?
With the help of the tools that identify these opportunities from an ocean of the data .
One of the tools they leverage is
Price action scanners!
So,
What are Price action Scanners?
Price action scanners, like the AfterPullback Market Scanner, are software tools designed to sift through a vast amount of market data and identify potential trading opportunities
How?
As the name suggests, these scanners identify opportunities based on the price movements of stocks. These price movements can be identified by taking into account different parameters like increased volumes or different candlestick patterns among many others.
They offer a significant advantage to active traders by automating the process of finding stocks that meet specific criteria.
While scanners can be valuable for various trading styles, their true power lies in their ability to cater to the specific needs of day traders.
Day Trading with Price Action Scanners
Day trading is a time sensitive trading style that focuses on exploiting short-term price movements within a single trading day. Day traders rely heavily on technical analysis and require constant monitoring of the markets. Price action scanners become instrumental in identifying these fleeting opportunities.
Here's how day traders can leverage price action scanners:
Focus on Volatility and Breakouts: Day trading thrives on market volatility. Scanners can be set to identify stocks experiencing high volume surges or significant price movements within a short timeframe. This allows day traders to jump on potential breakouts or breakdowns, aiming to capture quick profits before the market direction changes.
Tightening the Filter Net: Day trading demands a laser focus on highly liquid stocks with strong price movements during the day. Scanners offer various filtering options, allowing day traders to narrow down their search to stocks with high average daily trading volume and significant price swings within the chosen timeframe.
Risk Management and Stop-Loss Levels: While scanners can highlight potential entry points, day trading involves a higher degree of risk due to the short timeframes involved. Here, scanners can be used to identify potential support and resistance levels to set stop-loss orders and manage risk effectively.
High-Impact Day Trading Strategies with Price Action Scanners
Below we have compiled Five high-impact trading strategies that can be employed by day traders to identify the day trading opportunities. With each strategy, you will get what you need to set up in your scanner, how will you identify the trend, and then how will you execute this strategy?
This step-by-step approach will be easy for you to understand and will enable you to define similar setups for other strategies as well.
So, Lets Start!
Strategy 1: Breakout Trading: Capturing Momentum
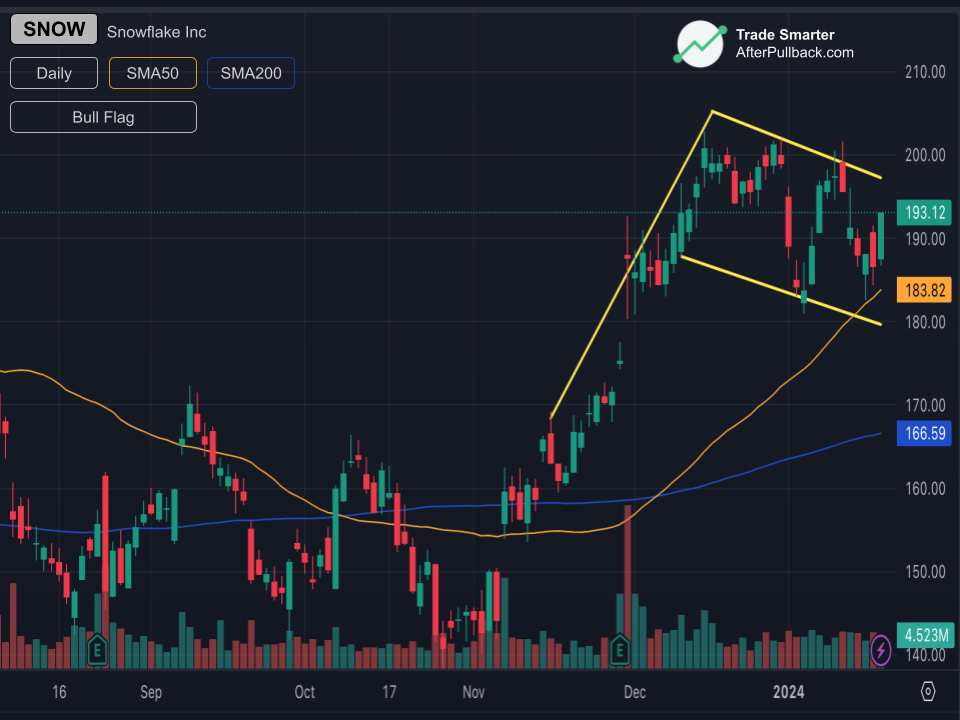
Here you configure your scanner to identify stocks with significant price jumps exceeding resistance levels (bullish breakout) or plunges below support levels (bearish breakout) within a specific timeframe. Ideally, you look for breakouts accompanied by a surge in trading volume, signifying increased market participation and potentially stronger trends.
For Example, The Picture above is an example of a breakout that created a bullish trend and generated a bull flag which might evolve into another breakout. Patterns like these can be detected using some scanners such as AfterPullback Market Scanner to identify technical trading opportunities real-time.
Scanner Setup for Breakout Trading:
To set this scanner, you may opt to add the following criteria
Price: Aim for higher percentage changes for breakouts as day trading often involves volatile stocks. (e.g., Many day traders may use a 3% to 5% price increase above resistance or decrease below support)
Timeframe: Since you're targeting day trades, focus on breakouts happening within a shorter timeframe. (e.g., Breakouts within the intraday timeframe, such as 5 minutes, 15 minutes, 1 hour, or any timeframe that fits your trading style)
Volume Spike: Day trading generally thrives on strong trends, so prioritize significant volume surges. (e.g., Volume increase of 100% or more above average daily volume)
How Similar Strategies Can be applied?
Don't rely solely on the scanner's output. Analyze the breakout on the chart. Look for technical indicators like moving averages to confirm the trend direction. For instance, a breakout above a rising 50-day moving average strengthens the bullish case.
There are various entry approaches for breakouts. Some traders enter immediately after the breakout for maximum potential gain, while others wait for a pullback (brief retracement) after the breakout for a more confirmed entry. Always set stop-loss orders below the breakout point for long positions and above for shorts to limit potential losses if the trend reverses. Take-profit orders can be based on predetermined price targets (e.g., aiming for a specific percentage gain) or trailing stop-loss orders that automatically adjust as the price moves in your favor.
Strategy 2. Fade the Trend: Countering Short-Term Extremes
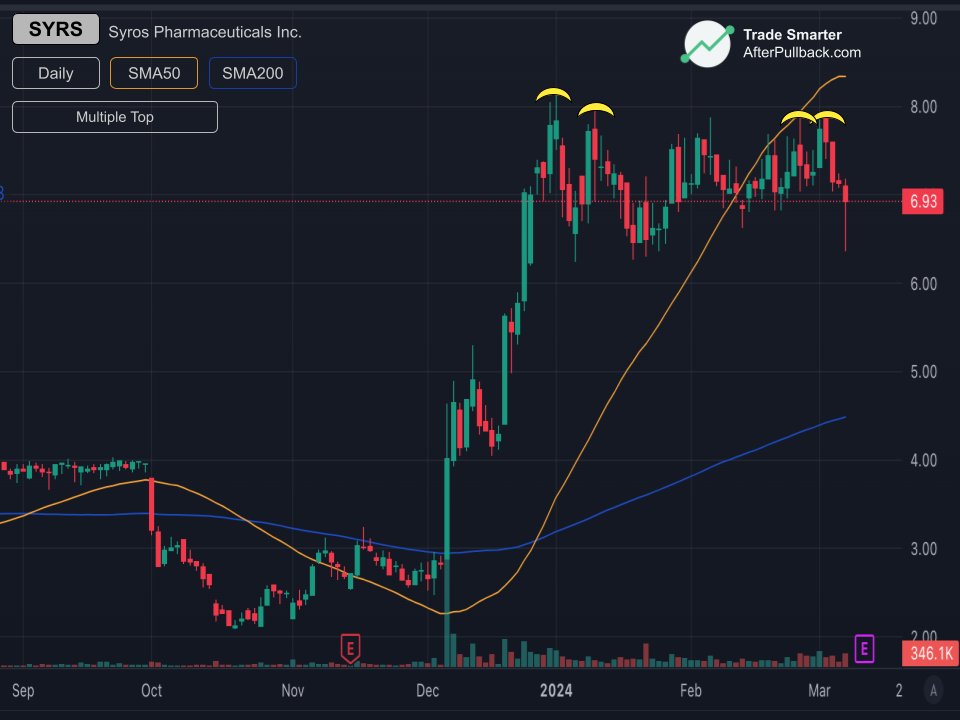
Utilize the scanner to unearth stocks experiencing dramatic price surges or plunges in a short period. These rapid movements might indicate overbought (upward surges) or oversold (downward plunges) conditions, making the stock ripe for a potential reversal.
Scanner Setup for Short Term Price Extremes:
You may set the following criteria in your scanner;
Price Movement: You can define the minimum percentage change for the dramatic price movement. You can consider separate filters for upward and downward movements (e.g., Price increase of 7% or decrease of 5%).
Timeframe: You can focus on short timeframes to capture rapid movements. (e.g., Price change happening within the last 30 minutes)
Reversal Indicators (Optional): Some scanners allow incorporating technical indicators specifically designed to identify overbought/oversold conditions like:
- Relative Strength Index (RSI)
- Stochastic Oscillator
You can set these indicators to reach extreme levels (e.g., RSI above 70 for overbought, below 30 for oversold)
Additional Considerations: While not crucial for reversals, you can consider including a minimum average daily volume filter to ensure some liquidity. Similarly, You might also target stocks with inherently higher volatility as they are more prone to dramatic price swings. Analyze historical volatility data to identify such stocks.
How Similar Strategies Can be applied?
After the initial surge or plunge, watch for signs of weakening momentum. This might include declining trading volume, even though the price keeps moving in the original direction. Additionally, look for reversal candlestick patterns on the chart, such as bearish engulfing patterns after a strong uptrend, suggesting a potential reversal.
Once you see signs of exhaustion, consider entering a short position (selling borrowed shares) for stocks that surged or a long position (buying) for stocks that plunged. Put stop-loss orders in place to mitigate risk. For short positions, the stop-loss could be placed above the recent swing high, and for long positions, below the recent swing low. Manage profit by using take-profit orders based on price targets or technical indicators that suggest the corrective move is losing steam.
Strategy 3. Range Trading: Capitalizing on Sideways Price Action
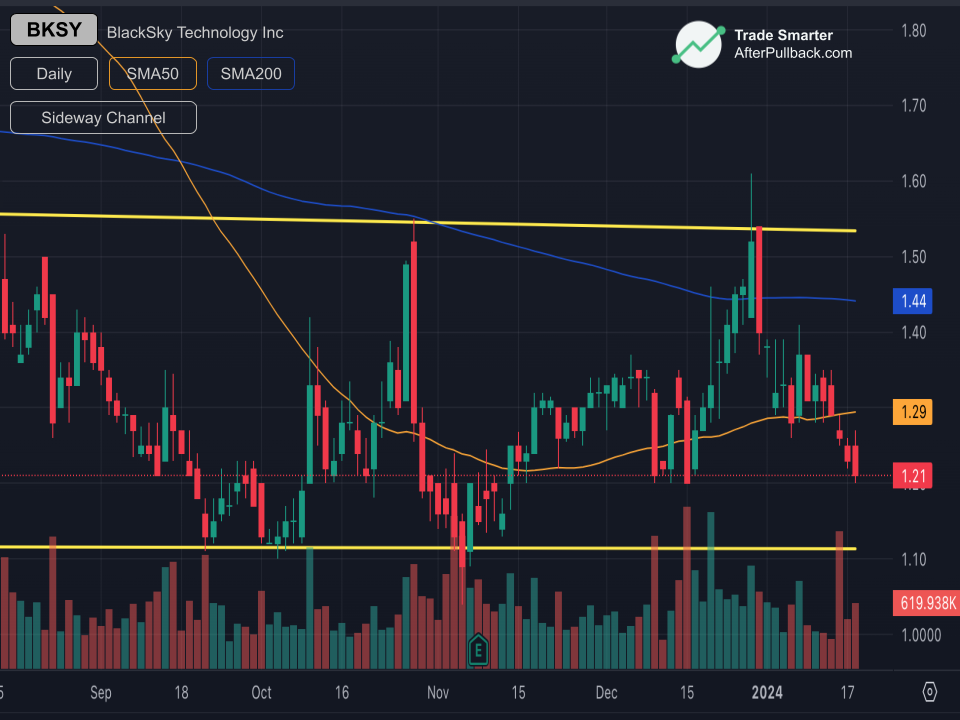
In this Strategy, you set the scanner to identify stocks that have been trading within a defined price channel (range) for a set period. This channel is typically characterized by horizontal support and resistance levels that the price has bounced between repeatedly.
Scanner Setup for Range Trading:
In Range Bound Trading, you may want to confirm;
Timeframe: Choose the timeframe for which you want to identify stocks in a channel. Common choices include daily, hourly, or even shorter timeframes depending on your trading style.
Price Range: Look for options to define a specific price range for the channel. You can input either a fixed percentage or absolute value for the range (e.g., Daily price range between $50 and $55).
Channel Confirmation: Some scanners allow incorporating technical indicators to confirm the presence of a channel. Consider including:
- Bollinger Bands: A channel can be identified if the price stays within the Bollinger Bands for a set period.
- Average True Range (ATR): This indicator measures volatility. A relatively low and consistent ATR over the chosen timeframe can suggest a channel.
Additional Considerations: While not essential, including a minimum average daily volume filter can ensure some liquidity for potential breakout trades.
How similar strategies can be applied?
Analyze the support and resistance levels within the range. These levels represent areas where the price has historically encountered buying or selling pressure, making them likely reversal points.
Look for price action signals near these support and resistance levels. For instance, if the price dips close to support and forms a bullish candlestick pattern like a hammer, it might indicate a potential buying opportunity. Conversely, if the price nears resistance and forms a bearish engulfing pattern, it could signal a selling opportunity.
Enter a long position (buy) near support if the price shows signs of bouncing back up. Conversely, enter a short position (sell) near resistance if the price appears likely to break down. Always place stop-loss orders just outside the support or resistance zone to limit potential losses if the price breaks out of the range unexpectedly. Take profit orders can be set at the opposite end of the range (reaching resistance for longs or reaching support for shorts).
Strategy 4. Gap Up/Down Trading: Exploiting Price Discontinuity
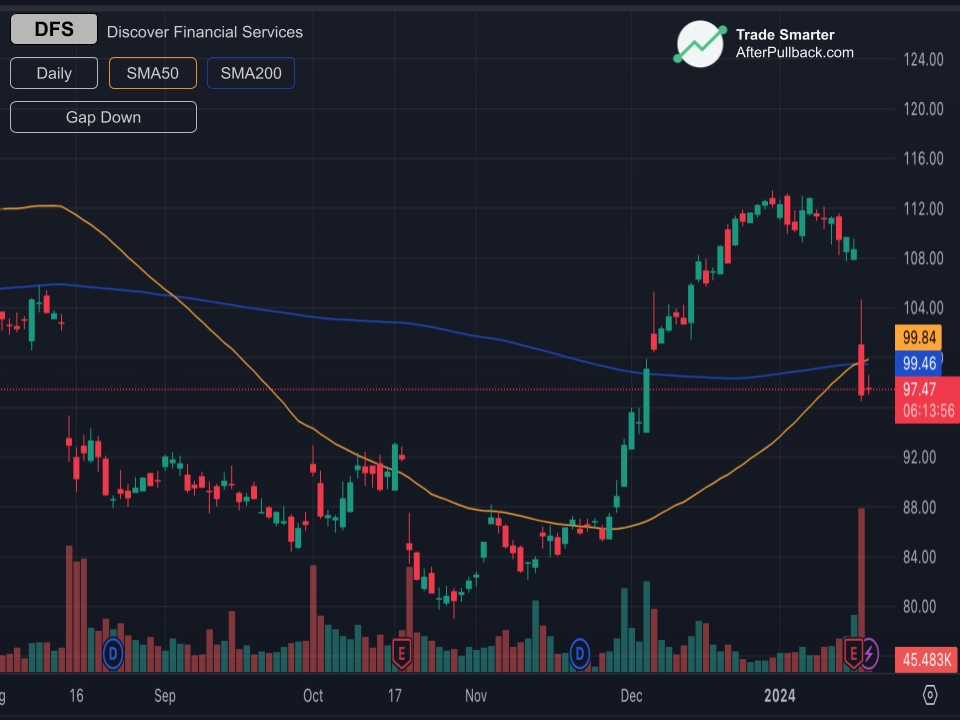
Here you configure your scanner to identify stocks that experience significant "gap up" (price opens significantly higher than the previous day's close) or "gap down" (price opens significantly lower than the previous day's close) openings. These gaps represent a price discontinuity, potentially signaling a volatile day ahead.
Scanner Setup for Gap Up/ Down Trading:
For the setup, you may want to consider
Gap Criteria: by defining the minimum percentage or absolute price difference for a significant gap. (e.g., Gap Up of 3% or more, You may also make it in $ terms, like , Gap Down exceeding $2)
Gap Direction: Choose separate filters for Gap Up and Gap Down scenarios depending on your trading strategy.
Additional Considerations (Optional):
- Volume: Include a minimum pre-market or opening volume filter to identify gaps with some buying/selling pressure behind them.
- News: You may also consider integrating news feeds with your scanner to see if any news events might explain the gap.
How Similar strategies can be applied?
Analyze the context surrounding the gap. Was there any major news release that could explain the gap? Look at the pre-market trading activity to gauge the sentiment. Large gaps on low volume might be less reliable than gaps accompanied by heavy pre-market trading.
There are two primary approaches for gap plays. You can trade in the direction of the gap, assuming the momentum will continue. For example, on a gap-up play, you might enter a long position (buy) shortly after the open. Alternatively, you can "fade the gap," anticipating a potential retracement to fill the gap. This strategy often involves entering a short position (sell) after a gap-up or a long position (buy) after a gap-down.
Gap plays can be volatile, so be cautious with entry points. Consider waiting for a confirmation signal, like a break above the gap high for longs on a gap-up or a break below the gap low for shorts on a gap-down, before entering a trade. Always use tight stop-loss orders to manage risk, as gaps can be quickly filled, leading to significant losses.
Strategy 5. VWAP Capture: Trading Around the Average
In VWAP Capture, you utilize your scanner to identify stocks with significant deviations from their Volume-Weighted Average Price (VWAP) for the day. VWAP represents the average price at which a stock has been traded throughout the trading session, factoring in both price and volume.
Scanner Setup for VWAP capture:
With this scanner setup, the following may be considered
Deviation Criteria: Here you define the minimum percentage or absolute value for a significant deviation from VWAP. (e.g., Price currently 2% above intraday VWAP or 1% below)
Direction of Deviation: You can set separate filters for prices above VWAP (indicating potential buying pressure) and below VWAP (indicating potential selling pressure) depending on your trading strategy.
Additional Considerations: You may also consider;
- Volume: Include a minimum daily volume filter to ensure the deviation is meaningful and not due to low trading activity.
- Changing Volume: Consider filters for changes in volume compared to the average daily volume. A spike in volume alongside a deviation from VWAP can strengthen the signal.
How similar strategies can be applied?
Look for stocks trading well above or below their VWAP. Stocks trading consistently above VWAP might indicate strong buying pressure, while those trading below might suggest selling pressure.
The core idea is to capitalize on the potential for the price to revert back towards the VWAP. For stocks trading above VWAP, consider entering a short position (sell) anticipating a price decline towards the average price. Conversely, for stocks trading below VWAP, a long position (buy) might be an option, expecting a price increase towards the average.
Don't solely rely on the deviation from VWAP. Look for additional confirmation signals on the chart, such as price-approaching resistance levels for potential short entries or support levels for long entries. Always implement stop-loss orders to manage risk, especially if the price breaks significantly away from the VWAP.
Conclusion:
In conclusion, price action scanners can be powerful tools for day traders by helping to identify potential breakout opportunities, reversal signals, and stocks experiencing unusual price movements.
By implementing the scanner setups outlined in this blog and tailoring them to your trading style and risk tolerance, you can gain an edge in your day trading game.
But,
Remember, a scanner is just one piece of the puzzle. Always conduct a thorough analysis, consider market conditions, and manage your risk effectively before entering any trade. This will enable you to
Trade Smarter!


