Exit Strategies with Scanners: Volume Confirmation and Overbought/Oversold Signals

In our Last Blog on exit signals, we discussed how to identify the exit signals with the help of Reversal Patterns, Support and resistance, and Moving Averages.
Today, we have two more tricks to identify exit signals.
This time, we're going to explore how to leverage volume analysis and overbought/oversold indicators to find the perfect time to jump out of a trade –
So,
Let's start right Away!
1) Using Volume Analysis for Exit Signals
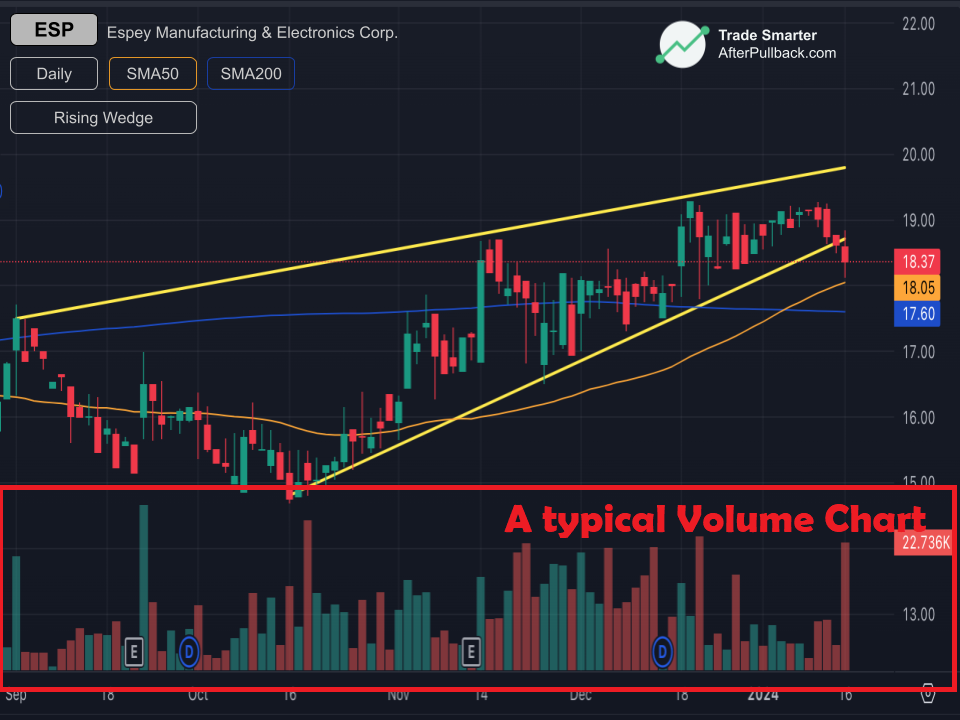
Volume analysis examines the quantity of shares traded in a security over a specific period. By understanding volume patterns, you can gain insights into market sentiment and identify potential exit points for your trades.
But why is looking at the Volume necessary?
You see,
As we saw for the entry signals using Price Action Scanner using different methods, including Gap Up and Down, Price action analysis identifies potential trends and reversals based on candlestick patterns and chart formations.
However, price movements alone don't tell the whole story.
Volume adds a crucial dimension by gauging market conviction behind the price action.
As an example, Let's Take Breakouts!
A breakout is a price move above resistance (uptrend) or below support (downtrend). High Volume on a breakout signifies strong buying or selling pressure, respectively, confirming the potential for a trend continuation. Conversely, low-volume breakouts might be short-lived and susceptible to reversal.
Not only that, but Volume also strongly relates to trend strength. Taking into consideration the strength of trends can significantly improve your trading performance.
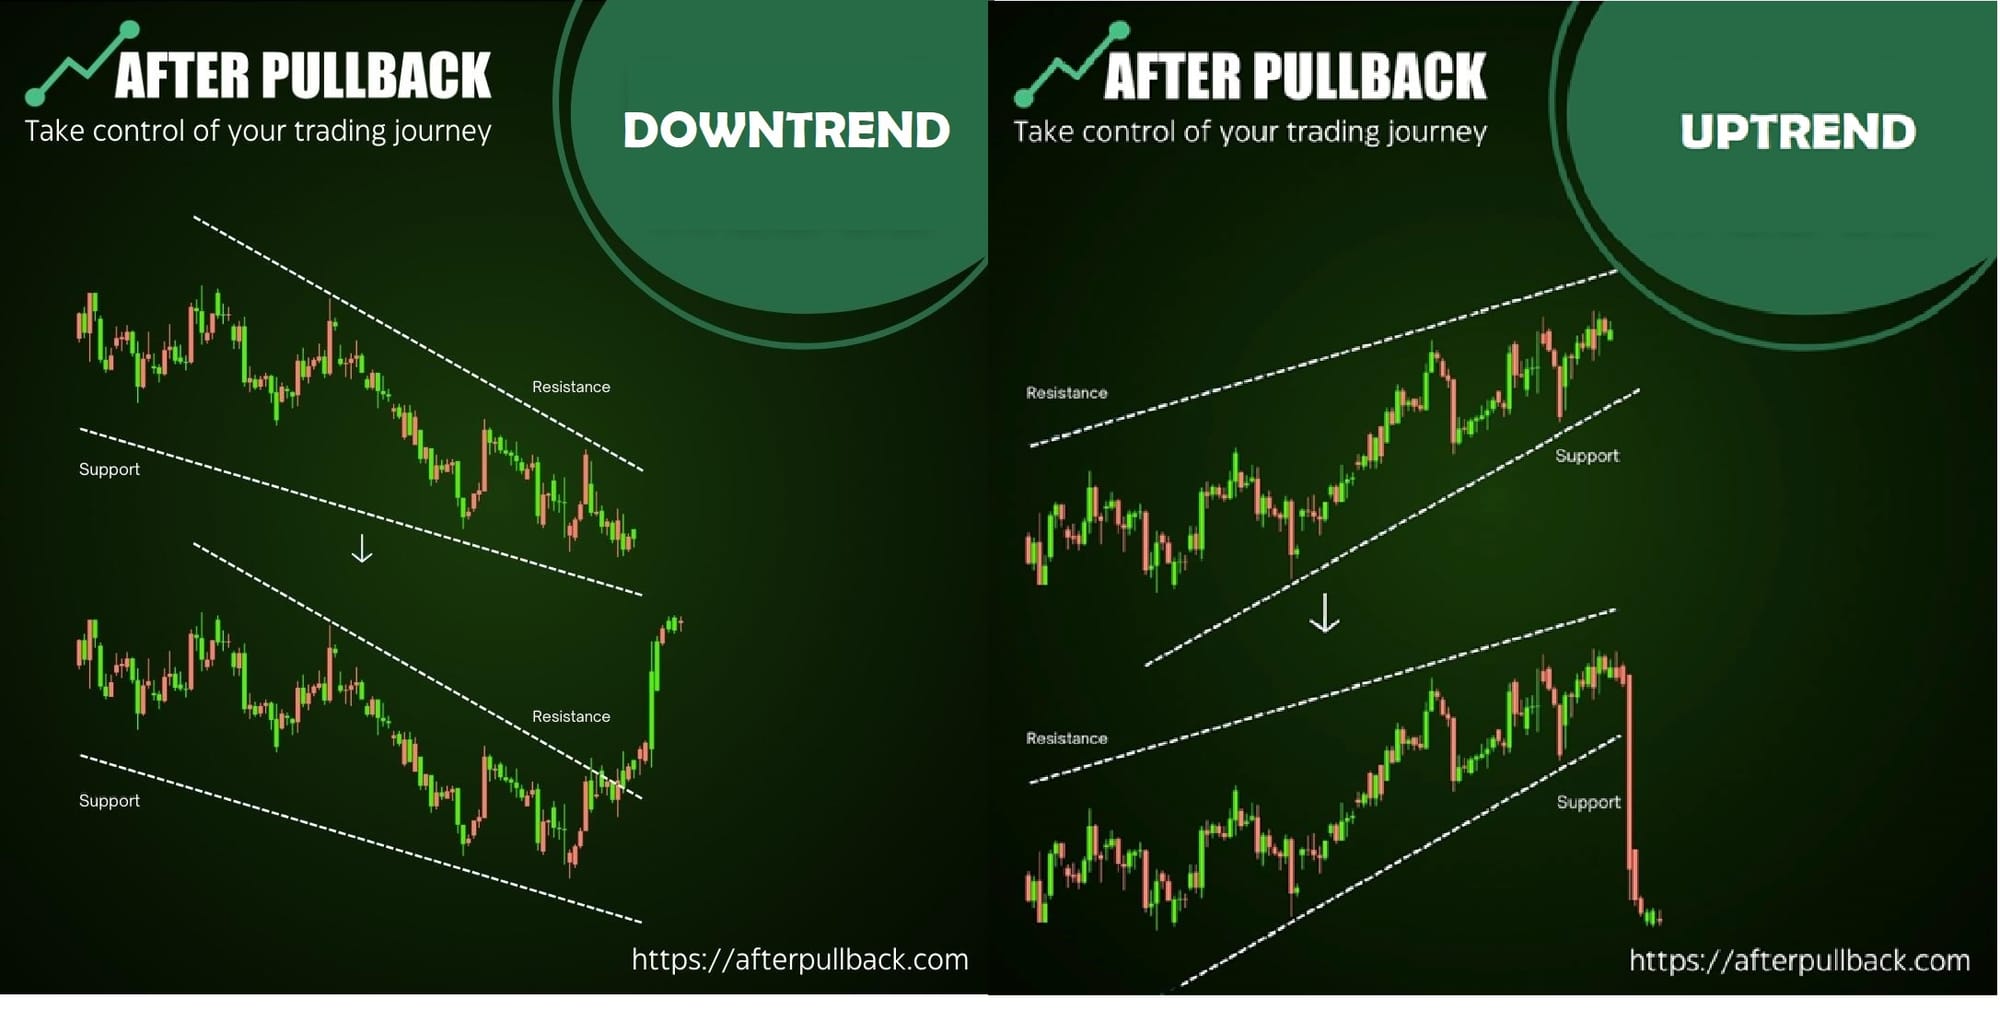
A downtrend accompanied by rising Volume suggests strong selling pressure, amplifying the bearish trend. This indicates that many market participants are actively selling, potentially driving the price down.
Conversely,
In an uptrend, if the price keeps rising but Volume decreases or stagnates, it could be a sign of weakening buying pressure. This divergence suggests the uptrend might be losing momentum and vulnerable to a reversal.
Something interesting also happens in situations called
Volume divergence.
This occurs when the price of an asset and the trading volume move in opposite directions. Here's how it can signal a potential trend reversal:
Bearish Divergence: This happens when the price makes new highs (upward trend), but the Volume of those highs is lower than that of previous highs. This suggests diminishing buying interest, potentially foreshadowing a trend reversal to the downside.
Bullish Divergence: Conversely, in a downtrend, if the price makes new lows (downward trend) but the Volume on those lows is lower than on previous lows, it might indicate weakening selling pressure. This could be a sign of potential buying interest accumulating, hinting at an upcoming reversal to the upside.
How do you use Price Action Scanner for Volume Analysis?
Price action scanners are powerful tools that can be enhanced by incorporating volume filters.
Most scanners allow filtering for specific price movements, such as breakouts, breakdowns (the opposite of breakouts), or tests of support/resistance levels.
Combine these price action filters with volume filters. Look for high Volume on breakouts or breakdowns. This indicates strong buying or selling pressure, potentially signifying a trend continuation opportunity.
Conversely,
Low-volume breakouts might be susceptible to reversal.
This information can give you Potential Exit Points
See,
If your entry was based on a breakout with high Volume, monitor subsequent price movements. A sudden spike in Volume against the trend direction (e.g., high Volume on a pullback in an uptrend) might indicate profit-taking by early bulls, suggesting a potential exit point to lock in gains.
Similarly,
Volume analysis can also help with stop-loss placement. If you enter a long position on a breakout with high Volume, consider placing a stop-loss below the breakout level with low Volume. This avoids getting shaken out by minor pullbacks and focuses on exiting if the Volume dries up, potentially signaling a trend reversal.
Scanner Specifics
Different scanners offer varying filtering capabilities. Explore the volume filters available in your chosen scanner. Common filters include minimum or maximum volume thresholds, volume changes (percentage increase/decrease), and comparisons to historical volume levels.
2) Using Overbought and Oversold Conditions for Exit Signals
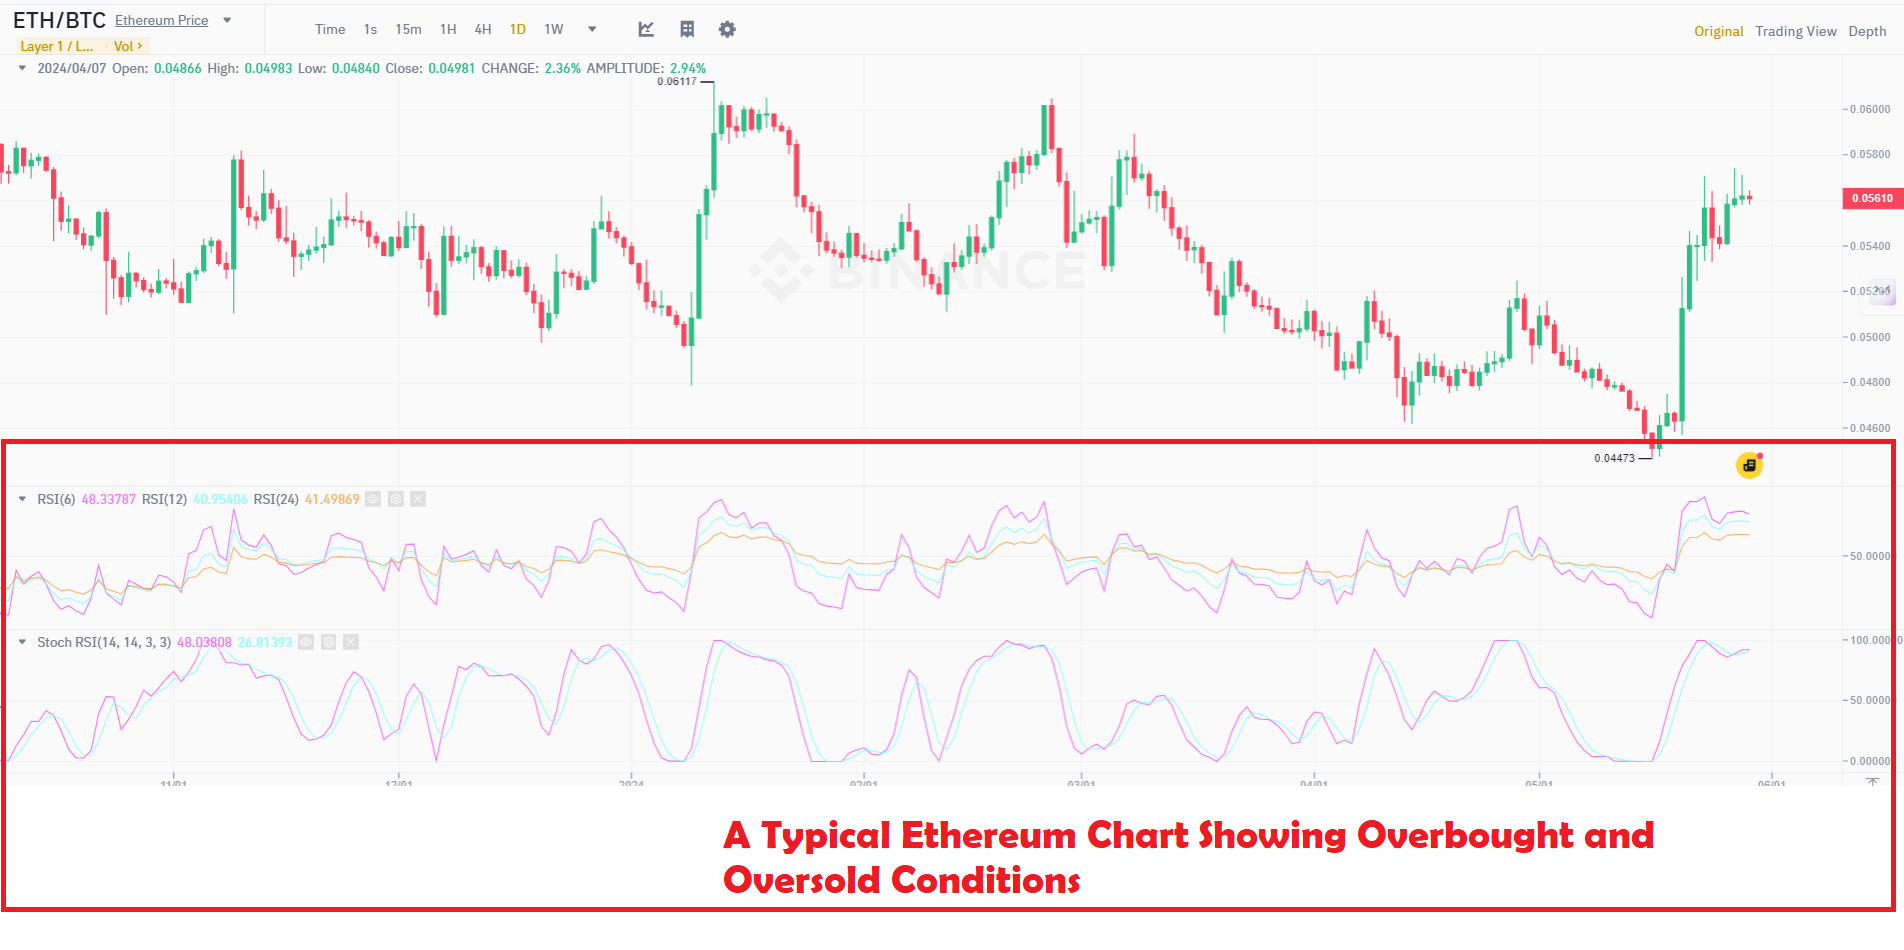
Overbought and oversold conditions describe an asset's price movement. They are identified using technical indicators that measure momentum or relative strength.
Overbought indicates an asset's price has risen sharply quickly, suggesting it may be due for a correction. This means that the asset's price may be higher than its intrinsic value, and investors may start to sell, driving the price down.
On the other hand,
Oversold suggests the price has fallen rapidly, and a potential rebound might be on the horizon. This means that the asset's price may be lower than its intrinsic value, and investors may be attracted to buying opportunities, driving the price up.
Although, these conditions don't guarantee a price reversal. The asset could continue trending in the same direction. However, overbought/oversold readings can suggest a period of consolidation or a potential trend change.
But, a couple of things to take into account regarding this
First,
These are relative concepts!
What is considered overbought for one asset may not be overbought for another. The overbought/oversold levels will also vary depending on the timeframe you are looking at.
And
Market conditions can influence them. For example, during a strong bull market, assets may become more overbought than usual before a correction occurs.
How to use Price Action Scanners for Exit Signals
Price action scanners can help traders identify assets nearing an exit point based on overbought or oversold conditions.
Most scanners, Like AfterPullback Market Scanner, allow you to filter based on various technical indicators. Popular choices for identifying overbought/oversold conditions include:
Relative Strength Index (RSI): When RSI readings are above 70, it suggests an overbought condition.
Stochastic Oscillator: Similar to RSI, readings above 80 indicate overbought territory.
Moving Average Convergence Divergence (MACD): Divergence between the MACD and signal lines can sometimes foreshadow a trend reversal.
Configuring Price Action Scanner for Overbought and Oversold Conditions
So,
Here is how you can configure your scanner step by step:
The first step is to Select Your Indicator:
Most scanners allow you to choose from various overbought/oversold indicators, such as the RSI, Stochastic Oscillator, or commodity channel index (CCI).
Next, you can set the Lookback Period.
This determines how far back the scanner will analyze the indicator's values. A typical range of 14-20 periods allows you to identify recent shifts in overbought/oversold conditions.
And in the last step,
You can set Exit Signal Filters
For Overbought Exits, You can Look for stocks where the chosen indicator value exceeds a specific threshold (e.g., RSI above 70). You can further refine this by including a filter for upward price movement to focus on potential profit-taking opportunities in long trades.
Similarly,
For Oversold Exits (Short Positions), You can scan for stocks where the indicator value falls below a specific threshold (e.g., RSI below 30). Consider adding a filter for a downward price trend to target potential exits for short positions.
The scanner will display a list of assets that meet your criteria. This list can be a great starting point for identifying potential exit opportunities.
And in all of this, Don’t forget
Confirmation is the Key!
Although Price action scanners are a great tool for identifying potential exit opportunities based on overbought/oversold conditions, it's crucial to remember that Confirmation with price action techniques is essential.
The reason is that,
Technical indicators like RSI and Stochastic can sometimes generate false signals. A high RSI reading doesn't guarantee an immediate reversal, and the price might increase.
This may be because the
Market Context Matters a lot!
Overbought readings in a strong uptrend might not be a reliable exit signal. Price action analysis helps consider the broader market context.
So,
How do you do this Confirmation?
You can use price action techniques alongside scanner signals to improve your exit strategy and trading performance.
The First thing that can be done is to,
Look for Reversal Candlestick Patterns
On the charts of scanned assets, you can Identify bearish reversal patterns like bearish engulfing, shooting stars, or bearish tweezer tops. These patterns, appearing after an overbought reading, suggest a potential price decline.
Also, have a look at the
Price Movement at Support/Resistance Levels
You can analyze whether the price is breaking support levels (a potential sell signal) or rejecting previous highs in an uptrend (another sign of overbought conditions).
Another thing that more experienced traders do is
use price action to gauge momentum. Is the price struggling to make new highs despite the overbought reading? This could indicate a weakening uptrend.
Did you see the Benefits of this Scanner-based Approach?
It saves us time by quickly filtering a large universe of assets. It also provides a data-driven starting point for an exit strategy. Confirmation through price action helps filter out misleading scanner signals and identify more reliable exit points.
But Never Forget
Risk Management
Although Price action scanners with volume filters and overbought/oversold indicators can be tempting tools for identifying exit points, relying solely on these signals can be risky without proper risk management strategies.
So, Always use stop-loss orders to limit potential losses. While scanner suggestions might inform stop placement, consider factors like volatility and historical support/resistance levels.
Don't risk a large portion of your capital on a single trade. Use a consistent position sizing strategy based on your risk tolerance and account size.
Consider trailing stop-loss orders to lock in profits as the price moves in your favor. Adjust these stops based on volatility and avoid getting shaken out by minor pullbacks.
Conclusion:
Entering a trade at the perfect time feels fantastic, but exiting at the right moment is what truly separates trading novices from the masters.
By understanding volume patterns and how these indicators work, you can pinpoint crucial exit moments to lock in profits or minimize losses. We even showed you how to configure your price action scanner to quickly identify these valuable exit signals.
Remember,
Successful trading is about making informed decisions. These tools won't guarantee perfect exits every time, but they'll give you a significant advantage by providing valuable insights into market sentiment and potential turning points. So, put these new skills to the test and watch your trading results soar!
Trade Smarter!


