Choose Your Stocks for Day Trading ONLY if they meet these Three criteria
Day trading is a speculative investment strategy involving buying and selling securities within the same day.
Successful day traders can generate significant returns by capitalizing on short-term price fluctuations. Quick profits are possible due to the rapid pace of the market.
But,
At the same time
Day trading is also inherently risky due to its short-term nature. Market conditions can change rapidly, leading to substantial losses.
To successfully navigate this volatile environment, it's essential to focus on stocks that exhibit specific characteristics. These qualities are crucial for executing trades efficiently and managing risk effectively.
In the following sections, we will delve deeper into the importance of these factors and how to identify stocks that possess the desired attributes for day trading.
Lets Start!
Key Factors for Stock Selection for Day Trading
Experienced traders enter the trade when at least some or all of the below critera are available for trading;
1) Volume
In Trading they say,
Volume is the King!
And its so true indeed.
because irrespective of the trading strategy or technical indicator or chart or pattern you are using, If the required volume is not there, A Day trading opportunity is difficult to form.
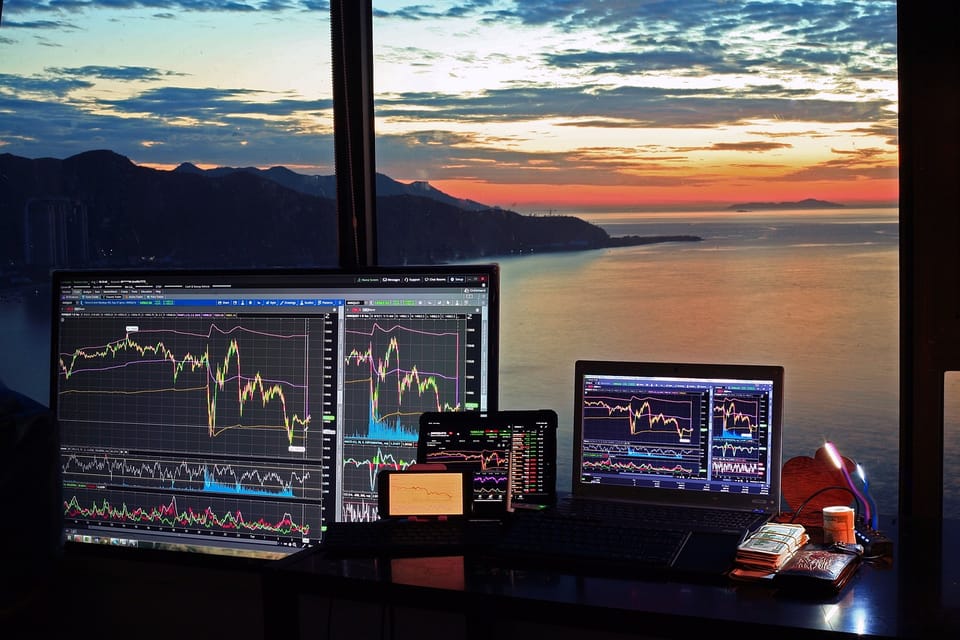
Volume refers to the number of shares traded for a specific stock during a given period. In day trading, it's a crucial factor that can significantly impact your trading decisions.
Why is Volume Important for Day Traders?
Volume is important because it ensures Liquidity. High volume indicates a stock with ample buyers and sellers. This ensures you can easily enter and exit positions without significantly affecting the price.
High Volume also gives rise to Price Volatility. Stocks with high volume tend to be more volatile. While this can increase risk, it also presents profit opportunities. Large price swings can occur quickly, allowing day traders to capitalize on these movements.
And not only that,
Volume can also provide clues about market sentiment. For instance, increasing volume during an uptrend suggests strong buying interest, while declining volume during an uptrend might signal weakening momentum.
High volume accompanying a price breakout or breakdown can confirm the validity of the move. This can be a powerful signal for day traders to enter or exit a position.
Ok, then the question arises,
How to Use Volume Effectively?
Experienced traders Analyze the current volume relative to the stock's average volume. A significant increase or decrease can indicate unusual activity.
What they do is to Look for sudden, sharp increases in volume, as these often precede significant price movements.
This gives them a Volume Confirmation. For example, a rising price with increasing volume suggests a stronger uptrend.
But,
You have to be a little bit careful when working with volume because of the volume divergence.
If the price makes a new high, but volume doesn't, it could signal a potential reversal.
So, Better watch out for such divergences.
2) Volatility
Day Trading thrives on Volatility,
Those price fluctuations can provide ample opportunities for profit.
Volatility refers to the rate at which the price of a security fluctuates. While it might sound daunting, it's a core element of day trading.
Why is Volatility Important for Day Traders?
Volatility Is important because of its Profit Potential.
High volatility means prices move rapidly in both directions. This can create significant profit opportunities for day traders who can accurately predict price movements.
But,
While volatility offers profit potential, it also increases the risk of losses. Rapid price fluctuations can lead to unexpected losses if not managed properly.
How to Identify Volatility?
While it's a complex concept with various mathematical calculations, there are practical ways to identify Volatility,
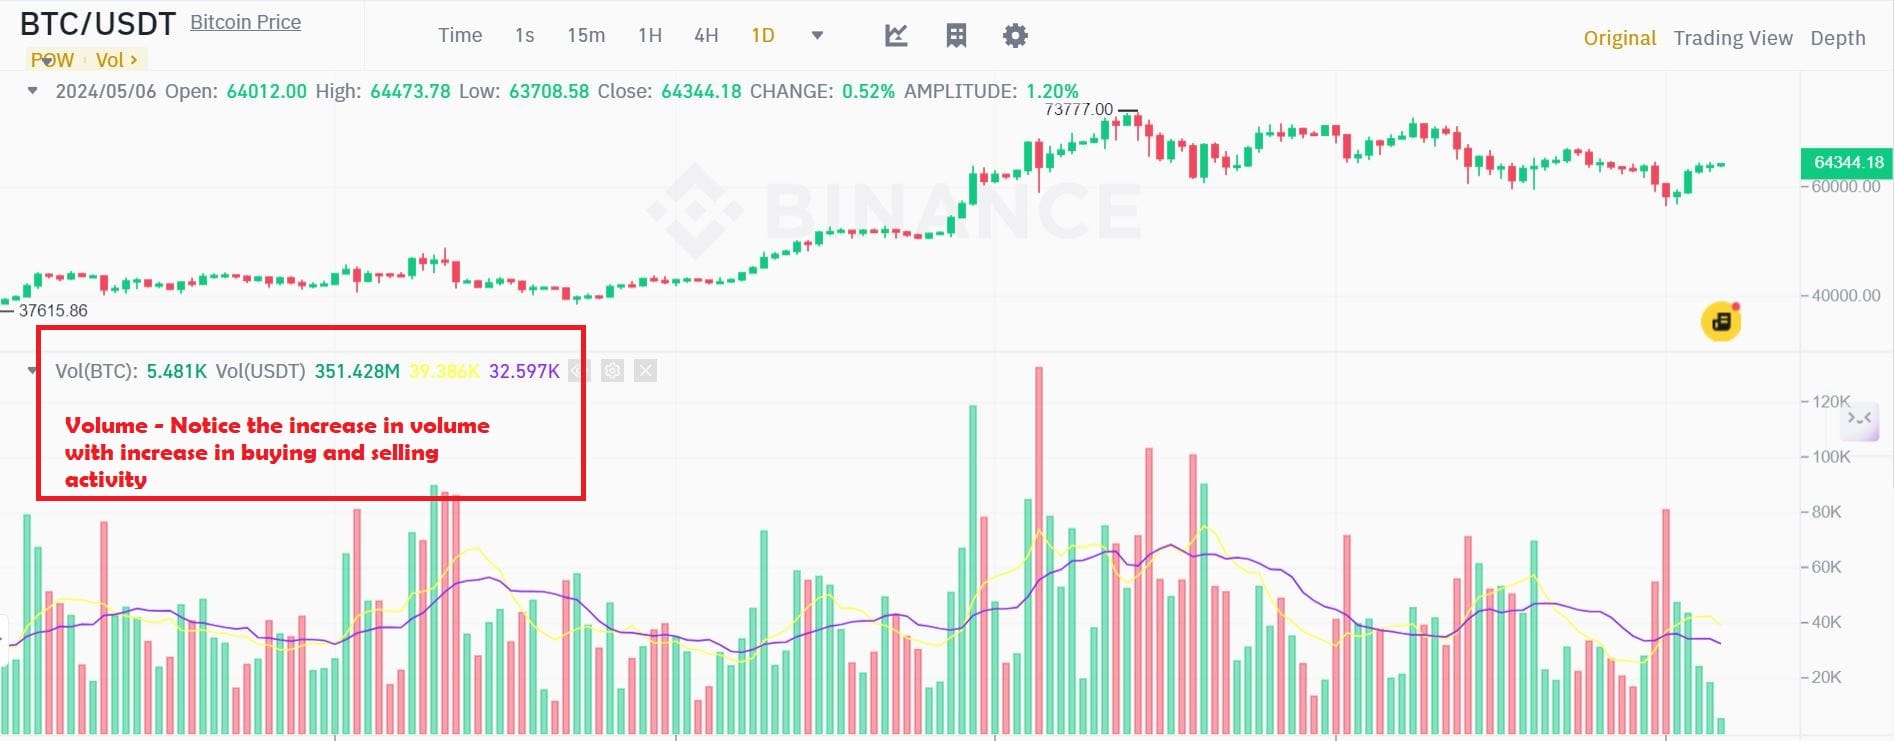
First of all, you can use Visual Analysis,
By Just looking at the price chart and identifying wide Price range between a stock's daily high and low suggests higher volatility.
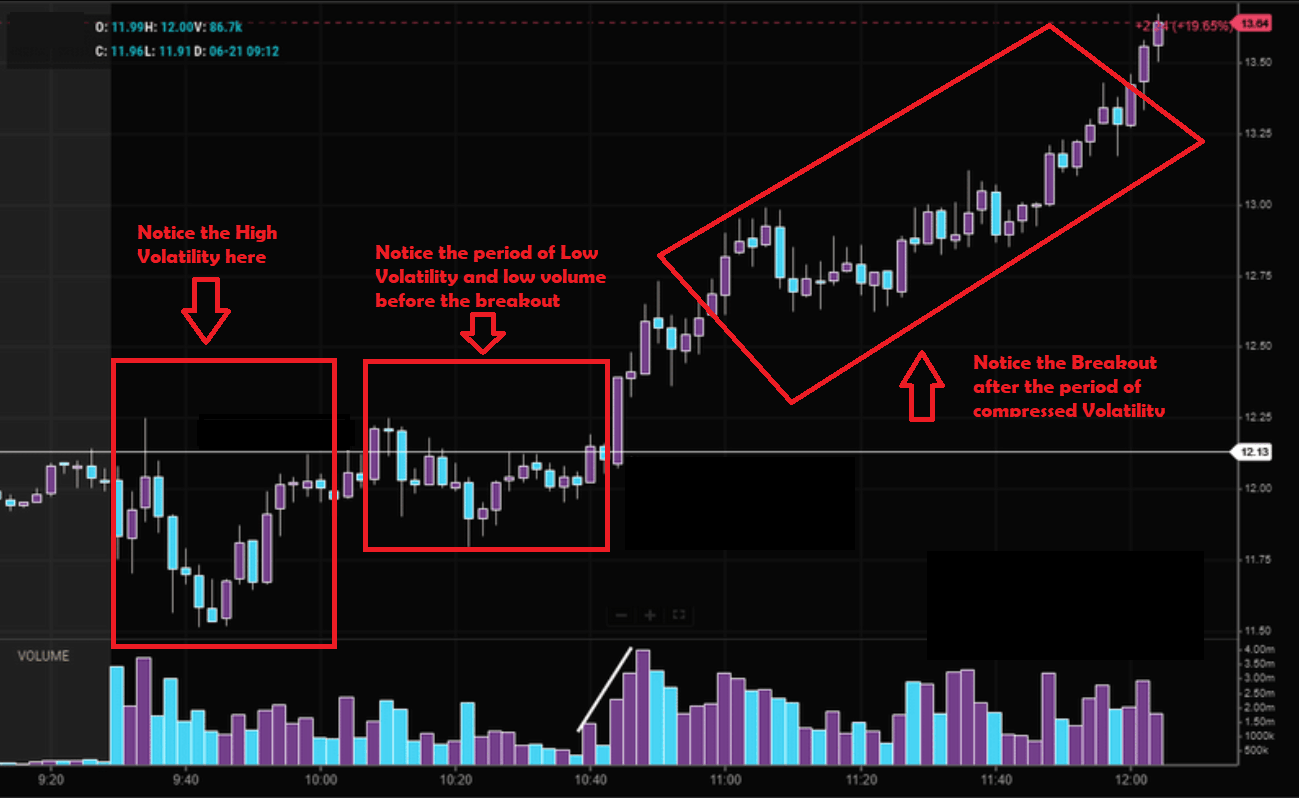
Similarly, certain candlestick patterns, are also there to help you out identifying volatility.
Doji, Spinning Top, and High Wave candlestick patterns are often associated with market indecision and can be powerful indicators of potential volatility.
Why These Patterns Signal Volatility?
1. Equilibrium of Forces: All three patterns - Doji, Spinning Top, and High Wave - represent a balance between buyers and sellers. This tug-of-war can be a precursor to a breakout in either direction, leading to increased price volatility.
2. Market Uncertainty: The indecision reflected in these patterns suggests a market struggling to find direction. This uncertainty can create conditions for rapid price movements once a clear trend emerges.
3. False Breakouts: Doji, Spinning Top, and High Wave can all appear after a strong price move, suggesting a potential pause before a continuation or reversal. This can lead to false breakouts, which are often accompanied by high volatility.
Also,
You can identify Volatility by employing some Technical Indicators like Bollinger Bands. These bands expand and contract based on volatility. Wider bands indicate higher volatility.
Similarly, Indicators such as average true range (ATR) directly measure price ranges, providing a numerical value for volatility.
How to Identify Profitable Opportunities with Volatility?
Day Traders often use scanners to navigate volatility. The resulting trade setups give them opportunities for
When volatility is high, but there's a clear price range, day traders can buy at the lower end of the range and sell near the upper end.
Day Traders can also do Breakout Trading. Significant price moves often follow periods of high volatility. Identifying and trading in the direction of these breakouts can be profitable.
Similarly,
Scalping Takes advantage of small price fluctuations within a short period. This is also a popular strategy in volatile markets.
3) Market Trends
The Last factor!
The Market Trend.
A market trend is the general direction of a financial market or asset price over a specific period. It's essentially the prevailing pattern of price movement.
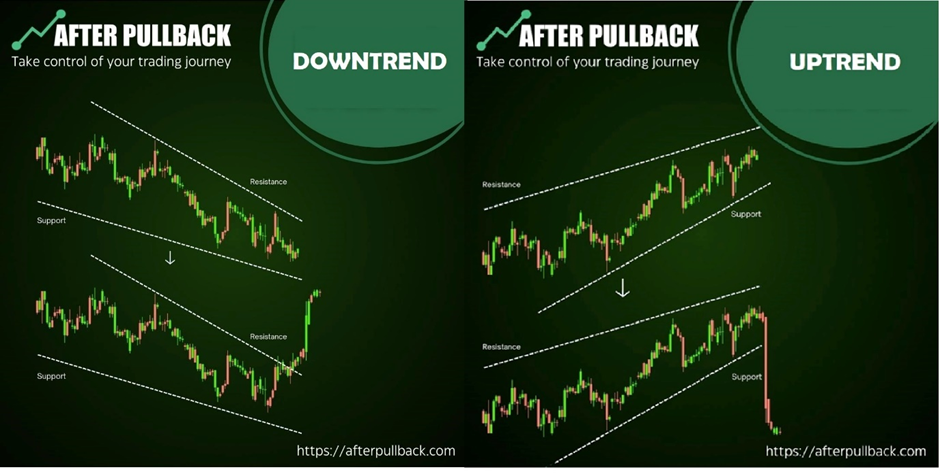
The trend can be an Uptrend, characterized by a series of higher highs and higher lows. It indicates increasing buying pressure and optimism.
Or
A Downtrend is defined by a series of lower lows and lower highs. It suggests decreasing buying pressure and pessimism.
It can also be a
A Sideways (or Range-bound) Trend, which occurs when prices fluctuate within a specific range without a clear upward or downward direction.
Why Market Trends Matter for Day Traders?
It's because, Market trends come up with Increased Probability of Profit.
Trading in the direction of the overall market trend significantly increases the chances of profitable trades.
Market trends are also very helpful in Identifying Opportunities for example, they can help identify potential breakout stocks or sectors that are likely to outperform.
Market trends also help in Risk Management. By understanding the broader market context, day traders can better manage risk and avoid counter-trend trades.
What are the Tools for Identifying Market Trends
To identify market trends, traders and investors rely on a combination of technical analysis and fundamental analysis tools.
Items such as Moving averages smooth out price fluctuations, making it easier to identify the underlying trend. When the price is above a moving average, it suggests an uptrend; when below, a downtrend.
Moving averages can also act as dynamic support and resistance levels.
Similarly, Support and Resistance Levels are price levels where buying (support) or selling (resistance) pressure is historically strong. Repeated bounces off these levels can confirm a trend. A break above resistance or below support can signal a potential trend reversal.
And not only that.
Traders often take the help of chart patterns to identify the market trend.
These chart patterns provide visual representations of price movements and can help identify potential trend continuations or reversals.
Here are some common ones:
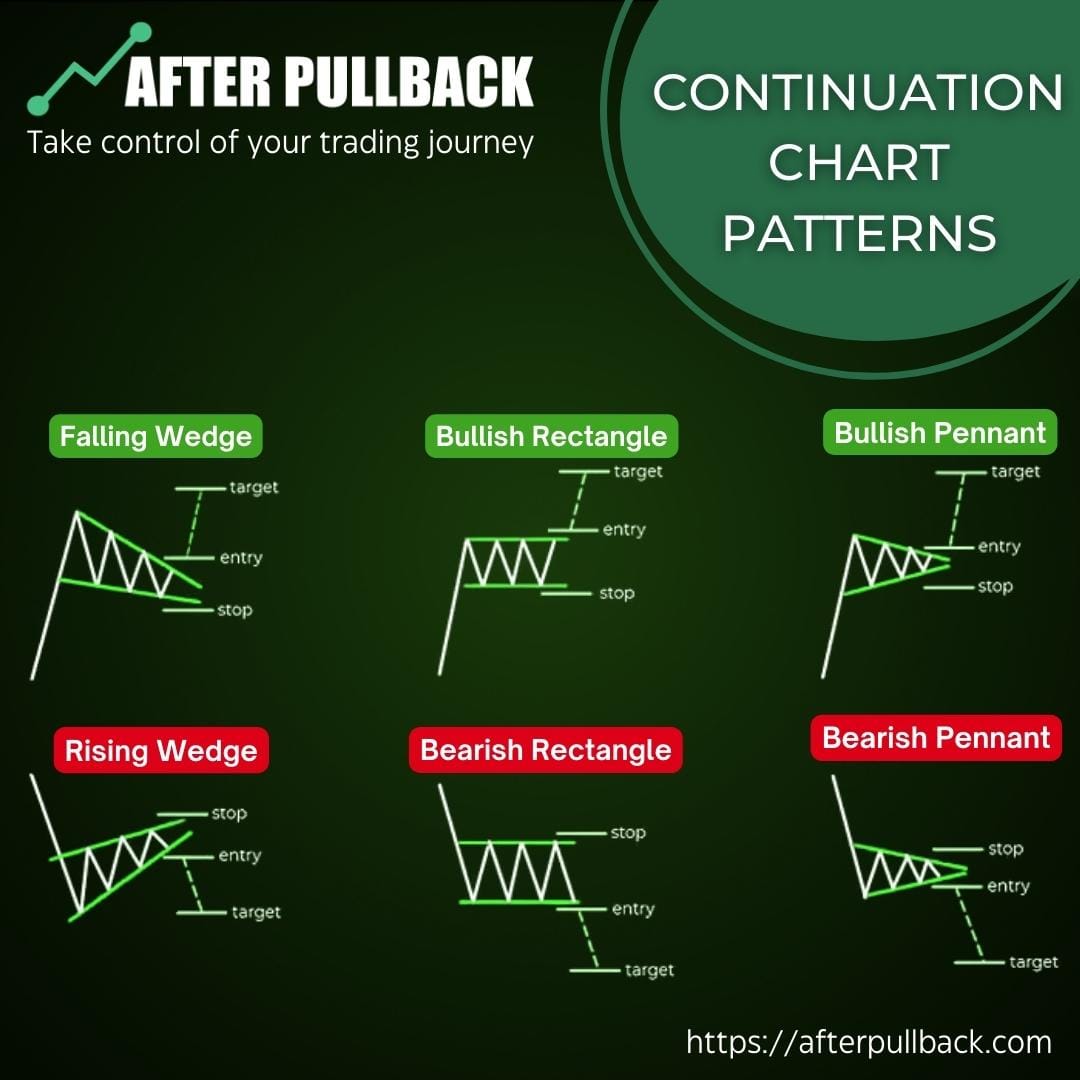
Continuation Patterns like Flags and Pennants suggest a temporary pause in a trend before it resumes. Similarly, Triangles also indicate a period of consolidation before a breakout in the direction of the existing trend.
Similarly,
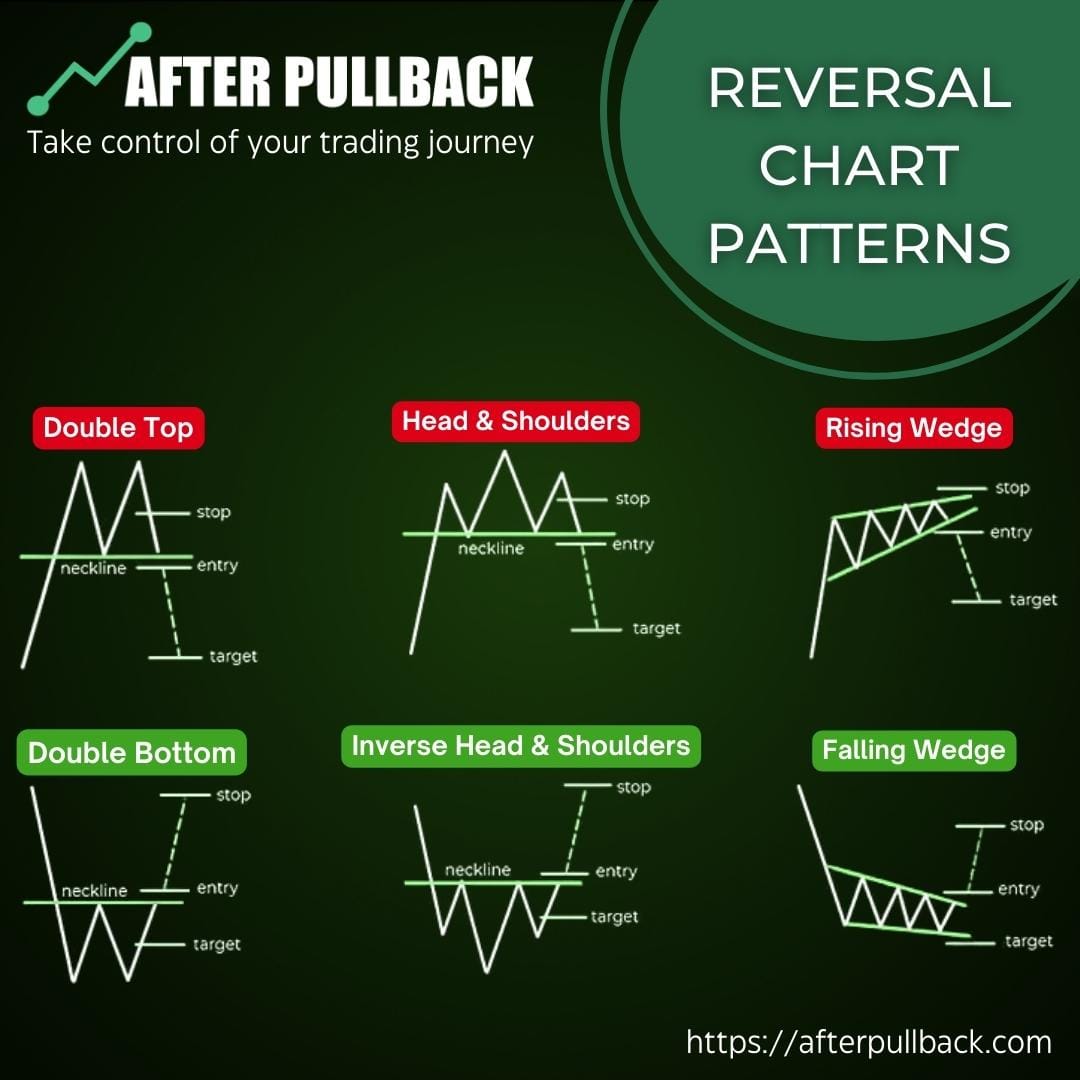
Reversal Patterns like Head and Shoulders are bearish patterns suggesting a potential trend reversal. Similarly, Inverse Head and Shoulders are a bullish pattern suggesting a potential trend reversal. Also Double Top/Bottom Indicates a potential trend reversal & Rounding Tops/Bottoms Suggests a gradual trend reversal.
How do day traders Utilize Market Trends?
Day Traders confirm the market trend by first Identifying the Trend, and determining whether the market is in an uptrend, downtrend, or sideways trend.
Once a trend is identified, they Select Stocks. They focus on stocks that are moving in the same direction as the overall market.
Once the Stock and its direction relevant to the overall market trend is identified, They Time their Entries and Exits to coincide with the prevailing trend.
And
Keep on Monitoring the trend for Trend Changes. They remain prepared to adjust their strategy if the market trend shifts.
Additional Tips
You see, Focusing on the above tips can give you a head start for your trading journey, But bear in mind, They are not the only factors to consider when consider entering or exiting a trade.
There are few additional tips as well.
- Focus on a Few Stocks: In-depth knowledge of a limited number of stocks is better than spreading yourself thin.
- Use Stop-Loss Orders: Protect your capital by setting predetermined exit points.
- Manage Risk: Diversify your portfolio and avoid over-leveraging.
- Practice and Learn: Start with a paper trading account to gain experience before risking real money.
Tools and Resources
- Stock Screeners: These tools help filter stocks based on various criteria.
- Charting Software: Visualize price movements and identify patterns. AfterPullback can be a great tool for this.
- News Sources: Stay updated on market news and company announcements.
Conclusion:
Remember,
Day trading is risky, You can gain and also You can lose money quickly. This strategy requires significant time and dedication & Your Emotional control is also very crucial for day trading Avoid impulsive decisions based on fear or greed.
If you can take into account all of this and include these criteria for your day trading strategy, this will increase your chances of success manyfold.
Trade Smarter!


